


Business Overview
Mynt, Inc. (PSE:GCASH), the parent company of GCash, made its Philippine Stock Exchange debut on October 20, 2026, at an initial public offering (IPO) price of ₱6.60 per share. The listing valued the company at approximately ₱441.51 billion, making it one of the largest publicly listed companies in the Philippines by market capitalization. The offering also became the largest IPO in PSE history, raising up to ₱60.9 billion through primary and secondary shares.
Mynt operates a financial technology ecosystem that extends beyond digital payments. Its businesses cover money transfers, lending, savings, investments, insurance, merchant payments, and other digital financial services. Its principal subsidiaries include G-Xchange, which operates the GCash wallet and payment platform, and FUSE Financing, which handles its lending business.
The company’s competitive advantage lies in its extensive customer base and the opportunity to offer multiple financial products through a single platform. Rather than relying exclusively on transaction fees, Mynt can generate additional revenue by encouraging existing users to adopt lending, savings, investment, and insurance products.
For investors, this creates an opportunity to participate in the growth of digital financial services in the Philippines. However, the investment case ultimately depends on the company’s ability to convert its market reach into sustainable earnings and cash flows.
Market Capitalization and Sector Position
At its IPO price of ₱6.60, Mynt’s market capitalization stood at approximately ₱441.51 billion. Market capitalization, or market cap, represents the total market value of a company’s outstanding shares. It is calculated by multiplying the share price by the number of outstanding shares.
The PSE identified Mynt as the seventh-largest domestic listed company by market capitalization at its debut. Its valuation placed it in the same broad market-capitalization league as established Philippine corporations, although its business model differs considerably from those of traditional conglomerates and banks.
The PSE classifies Mynt under the Financials sector and the Other Financial Institutions subsector. This distinction matters because Mynt is not a conventional commercial bank. Its revenue sources, operating risks, capital requirements, and valuation drivers differ from those of deposit-taking banks.
Among established listed financial companies, BDO Unibank and Bank of the Philippine Islands had market capitalizations of approximately ₱624 billion and ₱523 billion, respectively, around the time of Mynt’s listing. Mynt’s IPO valuation was therefore below those two banking giants but above Metropolitan Bank & Trust Company’s market capitalization of approximately ₱279 billion.
These comparisons provide useful context, but they should not be mistaken for a direct valuation comparison. Traditional banks and digital financial services companies have different business structures. Banks generate substantial income from lending spreads and other banking activities, while Mynt combines payments, technology-enabled financial services, and digital lending.
There is also an important limitation when comparing Mynt with other fintech companies: the Philippine market does not yet offer a large group of directly comparable, publicly listed digital-wallet operators. Consequently, Mynt’s valuation should be assessed using its own earnings, growth prospects, profitability, and risks, alongside carefully selected financial-sector comparables.
Revenue and Earnings Performance
Mynt reported revenue of approximately ₱43.27 billion for the first half of 2026, representing year-on-year growth of 10.4%. Net income reached approximately ₱10.82 billion, an increase of 7.3% from the corresponding period in 2025.
These results demonstrate that Mynt is already a profitable business rather than a fintech company whose valuation depends entirely on future earnings that have yet to materialize.
However, the relationship between revenue growth and earnings growth deserves closer examination. Because Mynt’s revenue grew faster than its net income, its profitability weakened slightly relative to the amount of revenue generated.
Based on the reported growth rates, first-half 2025 revenue was approximately ₱39.19 billion, while net income was approximately ₱10.08 billion. This implies a net profit margin of approximately 25.7% in the first half of 2025, compared with approximately 25.0% in the first half of 2026.
Net profit margin measures how much of every peso of revenue remains as net income. A margin of 25.0% means that Mynt retained approximately ₱0.25 in net income for every ₱1.00 of revenue generated.
The decline from approximately 25.7% to 25.0% is relatively modest, but it reveals an important development: additional revenue did not translate proportionately into additional profit.
This does not automatically indicate deteriorating business quality. A growing financial services company may incur additional technology, personnel, marketing, compliance, and customer acquisition expenses as it expands. A lending business may also recognize higher credit-loss provisions as its loan portfolio grows. These are potential explanations, but the difference between revenue and net income alone does not establish which factor caused Mynt’s margin compression.
For fundamental analysis, the key finding is that earnings growth lagged revenue growth and the net profit margin declined slightly. The underlying expense and credit-loss disclosures should be interpreted in that context rather than attributing the change to a particular expense without sufficient evidence.
The next question is whether Mynt can accelerate earnings growth as its business scales. If revenue continues expanding while operating costs grow more slowly, the company could benefit from operating leverage. Operating leverage occurs when a business generates additional revenue without a proportionate increase in operating expenses, allowing a larger share of incremental revenue to flow into operating profit.
Conversely, if the company must continually increase spending or absorb higher credit losses to sustain growth, its profitability may remain under pressure.
Customer Base and Growth Potential
One of Mynt’s strongest fundamental advantages is its established user base. GCash had approximately 41.5 million monthly active users for the three months ended June 2026, equivalent to roughly 56% of the Philippine adult population.
The company also processed approximately ₱9.84 trillion in payment transactions during the first half of 2026.
These figures demonstrate the scale of the platform, but they must be interpreted correctly. Monthly active users measure engagement with the service, while transaction value measures the amount of money moving through the platform. Neither figure is equivalent to revenue or profit.
For example, processing ₱1,000 in payments does not mean that GCash earns ₱1,000. The revenue generated depends on the applicable transaction fees, merchant arrangements, financial products used, and other monetization mechanisms.
The significance of GCash’s scale is that it provides Mynt with an existing customer base to which it can offer additional services. A user who initially opens an account to transfer money may later use the platform to borrow funds, save, invest, or purchase insurance.
This strategy can increase revenue per user without requiring the company to acquire an entirely new customer for every product. It may also strengthen customer retention by making the platform more useful for everyday financial activities.
However, customer growth alone is insufficient. Investors should look for evidence that active users are spending more time on the platform, adopting more products, and generating profitable revenue. A large customer base becomes a stronger financial asset when it produces sustainable earnings rather than merely high transaction volumes.
Profitability and Return on Equity
Another useful measure of Mynt’s financial performance is return on equity (ROE).
ROE measures how effectively a company generates profit from shareholders’ equity. In simple terms, it indicates how much net income a company earns for every peso of equity invested in the business.
Figures reported from Mynt’s prospectus indicate ROE of approximately 25.8% in 2023, 32.8% in 2024, 32.1% in 2025, and 26.8% for the twelve months ended June 2026.
These figures indicate that Mynt generated substantial returns on shareholders’ equity over the periods examined. A consistently high ROE can indicate a profitable business model, effective capital utilization, or both.
Nevertheless, ROE should not be interpreted in isolation. It can be affected by leverage, changes in equity, exceptional gains, and the timing of capital transactions. Investors should therefore consider the company’s earnings quality, balance sheet, and cash flows alongside ROE.
For Mynt, the combination of established profitability and a large customer base provides a foundation for further expansion. The challenge is to sustain those returns as the company grows and invests in new financial products.
Valuation Analysis
At ₱6.60 per share, Mynt’s market capitalization was approximately ₱441.51 billion.
One of the most commonly used valuation measures is the price-to-earnings ratio, or P/E ratio. It compares a company’s market value with its earnings and indicates how much investors are paying for each peso of profit.
To obtain a preliminary valuation reference, Mynt’s first-half 2026 revenue and net income can be annualized by multiplying each figure by two. This produces estimated annual revenue of approximately ₱86.54 billion and annual net income of approximately ₱21.64 billion.
Using these estimates, Mynt’s implied P/E ratio at the IPO price was approximately 20.4 times, while its price-to-sales ratio was approximately 5.1 times.
These are annualized run-rate multiples, not trailing-twelve-month multiples. The distinction is important for new investors.
A trailing-twelve-month, or TTM, measure uses the actual results reported over the most recent four quarters. Annualization, by contrast, takes a shorter reporting period—six months in this case—and extrapolates it to a full year by multiplying the figures by two.
Annualization is useful when investors want an initial valuation reference before a company has accumulated a full year of results as a listed company. However, it assumes that the second half of the year will produce results comparable to the first half. Actual results may differ because of seasonality, changes in business activity, operating expenses, credit losses, and other factors.
A TTM P/E ratio is generally more informative when the necessary financial data are available because it reflects actual earnings across a complete twelve-month period rather than an extrapolation.
The P/E ratio of approximately 20.4 times means that investors are paying about ₱20.40 for every peso of annualized net income. This is not inherently expensive or cheap. The appropriate valuation depends on expected earnings growth, the durability of profits, financial risks, and the returns investors require for holding the stock.
A company capable of consistently increasing earnings may justify a higher P/E ratio than a company whose profits are stagnant. However, a high-growth narrative cannot compensate indefinitely for disappointing financial performance.
The price-to-sales ratio of approximately 5.1 times provides another perspective. It indicates that the market values Mynt at roughly ₱5.10 for every peso of annualized revenue. Because revenue does not account for expenses, two companies with identical price-to-sales ratios may have very different valuations if their profit margins differ substantially.
For this reason, Mynt’s P/E ratio, earnings growth, and net profit margin should be evaluated together rather than relying on a single valuation metric.
Use of IPO Proceeds
The IPO raised funds through a combination of primary and secondary shares. This distinction is important when evaluating the financial implications of the listing.
Primary shares are newly issued shares, and the proceeds go to the company. Secondary shares are existing shares sold by shareholders, and the proceeds go to the selling shareholders.
According to the PSE’s final IPO terms, the offering included approximately 1.61 billion primary shares and 6.42 billion secondary shares, with an additional secondary-share over-allotment option.
Consequently, the headline amount raised through the IPO should not be treated as cash received entirely by Mynt. The company’s direct capital-raising benefit comes from the primary portion.
The proceeds from the primary offering are intended to support digital financial services expansion, product development, and general corporate purposes.
For shareholders, the important consideration is how effectively the company deploys the additional capital. Capital raised through an IPO creates value when it helps generate future earnings and cash flows that justify the additional equity invested in the business.
Investors should therefore monitor whether Mynt’s expansion initiatives translate into higher revenue per user, stronger earnings, improved product adoption, and attractive returns on invested capital.
Competitive Advantages and Principal Risks
Mynt benefits from its extensive customer base, established brand, and broad digital financial services ecosystem. Its corporate backing and access to capital may also support technology investments and product development.
However, these advantages do not eliminate competitive risks.
Traditional banks, other digital wallets, and financial technology providers can compete through pricing, customer incentives, product features, and service reliability. Sustaining market share may require continued investment in cybersecurity, technology, customer support, and regulatory compliance.
Credit risk is another important consideration because lending forms part of Mynt’s business. As the loan portfolio expands, the company must ensure that revenue growth is not undermined by rising defaults or credit-loss provisions.
Regulatory developments may also affect the company’s operations. Digital financial services involve consumer protection, data privacy, cybersecurity, anti-money laundering requirements, and regulatory oversight of relevant financial products.
Finally, investors should distinguish business performance from stock valuation. A profitable company can still deliver disappointing investment returns if its shares are purchased at a price that already assumes overly optimistic growth.
Fundamental Valuation Outlook for the Next 6–12 Months
The following scenarios are derived from Mynt’s reported financial performance, annualized earnings, and illustrative valuation multiples. They are fundamental valuation scenarios, not technical-analysis forecasts based on price patterns, support and resistance, volume, or momentum indicators.
At the IPO price of ₱6.60, the implied market capitalization was approximately ₱441.51 billion. Using annualized first-half net income of approximately ₱21.64 billion, the implied P/E ratio was approximately 20.4 times.
For an illustrative valuation exercise, consider three possible earnings and valuation outcomes.
In a bullish fundamental scenario, Mynt’s earnings growth accelerates, its profit margin stabilizes or improves, and its lending operations maintain sound credit quality. If annual earnings were to reach approximately ₱25 billion and the market valued the company at 22 times earnings, the implied equity value would be ₱550 billion. Based on approximately 66.90 billion outstanding shares, that would translate to roughly ₱8.22 per share.
In a base-case fundamental scenario, earnings continue to grow, but the pace remains moderate and the market maintains a valuation of approximately 20 times earnings. If annual earnings reached ₱23 billion, the implied equity value would be ₱460 billion, equivalent to approximately ₱6.88 per share.
In a bearish fundamental scenario, earnings growth disappoints or profitability deteriorates, causing investors to apply a lower earnings multiple. If annual earnings reached ₱20 billion and the market valued the company at 17 times earnings, the implied equity value would be ₱340 billion, equivalent to approximately ₱5.08 per share.
These scenarios are not broker consensus estimates or statistically derived price targets. The earnings assumptions and valuation multiples are illustrative inputs used to show how changes in profitability and investor valuation can affect the implied share price. They are not predictions of actual future earnings.
The calculation also uses the post-IPO share count of approximately 66.90 billion shares. Future share issuances, changes in capital structure, or other corporate actions could affect the per-share valuation.
The purpose of this exercise is to establish a fundamental valuation framework. It does not determine when the stock might reach any particular price, whether a short-term breakout is likely, or where technical support and resistance levels may lie. Those questions belong in my separate technical analysis.
GCASH Technical Analysis for October 20, 2026
In GCASH’s 5-minute intraday chart, the stock began trading confidently at its IPO debut price of ₱6.60 per share. However, pessimistic intraday trading sentiment emerged 10 minutes after the first five minutes of trading.
Despite this initial weakness, GCASH recovered and eventually reached an intraday high of ₱6.76 per share.
Forty minutes after the opening bell, GCASH began registering a declining intraday price, eventually settling at its opening price of ₱6.60 per share.
For the October 21 trading session, ₱6.60 serves as intraday support, while ₱6.66 represents intraday resistance. Should GCASH pierce ₱6.62 with significant trading volume, the stock would be more likely to revisit ₱6.66 and potentially break above it, paving the way toward ₱6.70.
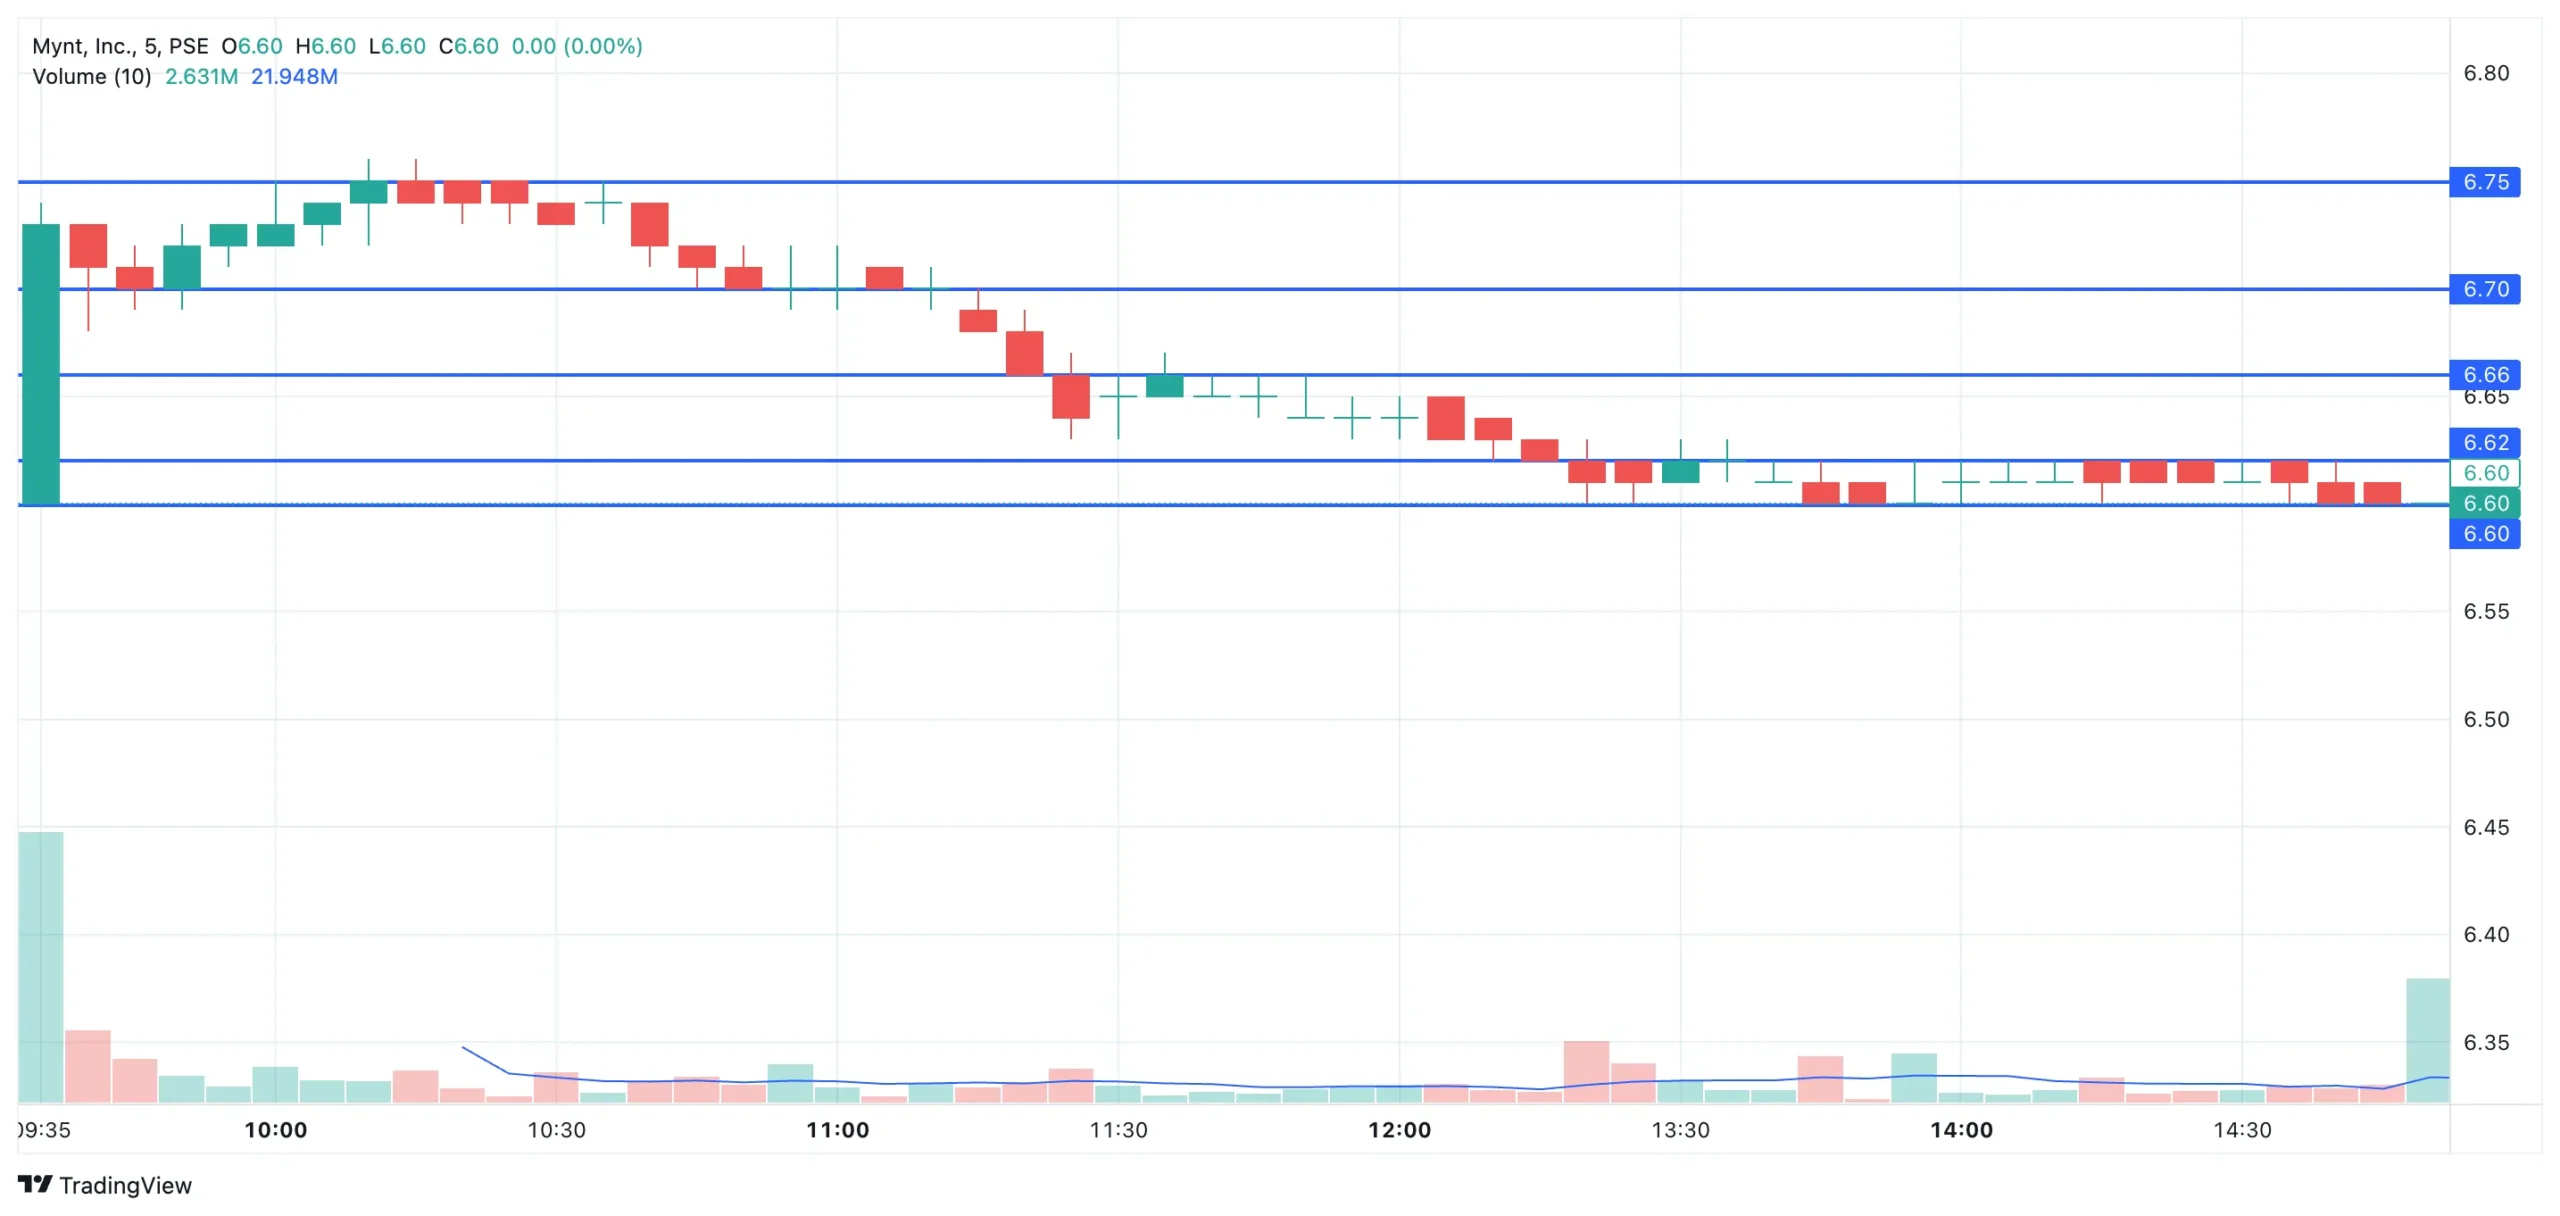
Dominant Range Index
- Dominant Range Index: BEARISH
- Last Price: ₱6.60
- Dominant Range: ₱6.60–₱6.61
- VWAP: ₱6.6529
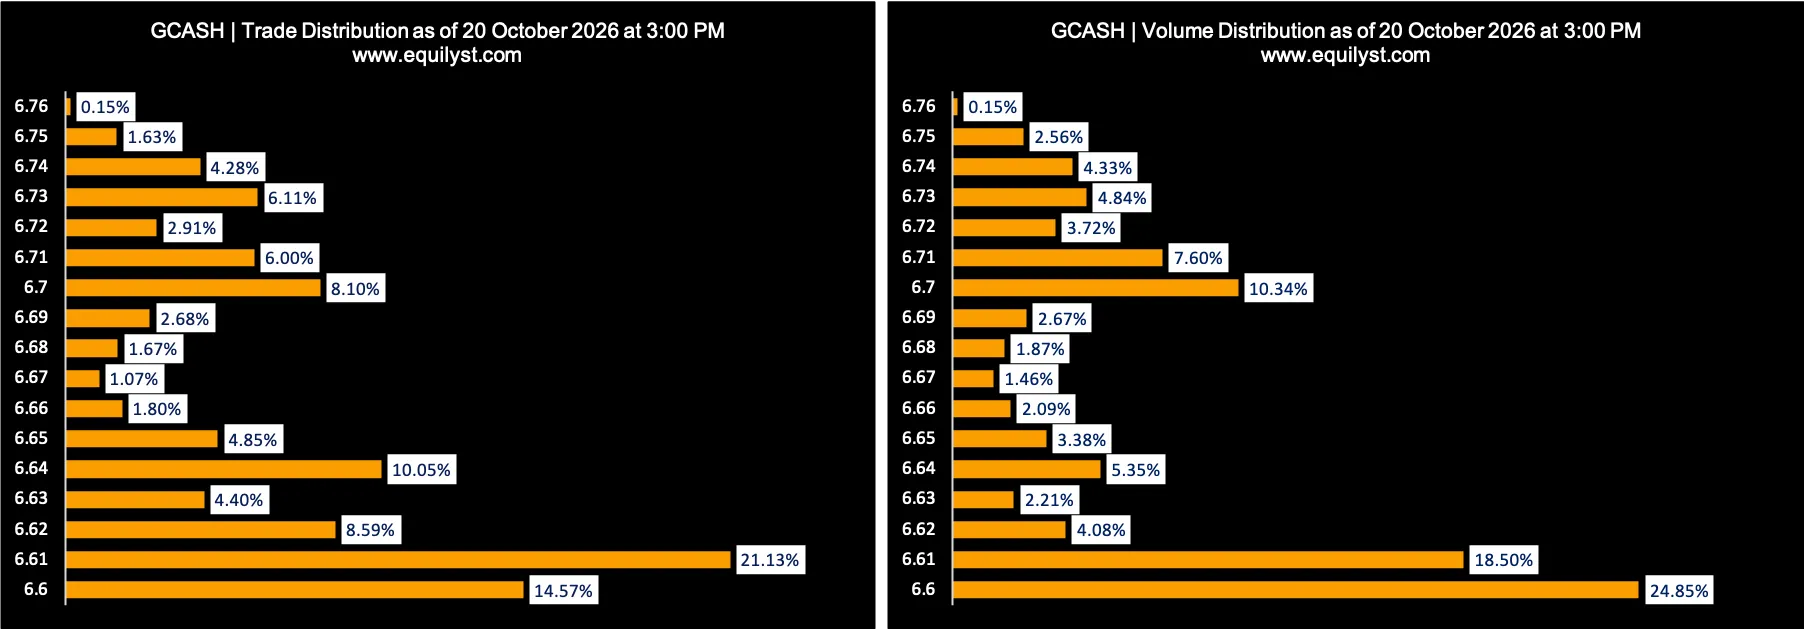
GCASH’s Trade and Volume Distribution chart shows that a significant portion of the day’s trading activity occurred closer to its intraday low than to its intraday high. Furthermore, the stock’s last price failed to close above its volume-weighted average price (VWAP) of approximately ₱6.65.
VWAP, or volume-weighted average price, represents the average price at which a stock traded throughout a given period, with greater weight assigned to prices at which more shares changed hands. Traders often use it as a reference for assessing the stock’s price relative to the day’s trading activity.
GCASH’s last price of ₱6.60 was below its VWAP of ₱6.6529, indicating that the stock finished the session below its volume-weighted average trading price. Combined with the concentration of trading activity near the lower end of its intraday range, this contributed to the bearish reading of the Dominant Range Index.
Market Sentiment Index
- Market Sentiment Index: BEARISH
- 40 of the 100 participating brokers (40.00%) posted a positive Aggregate Net Amount
- 42 of the 100 participating brokers (42.00%) posted a higher Per-Broker Buying Average than Per-Broker Selling Average
- Aggregate Buying Average: ₱6.66119
- Aggregate Selling Average: ₱6.66879
- 10 out of 100 participants (10.00%) registered 100% Per-Broker BUYING activity
- 11 out of 100 participants (11.00%) registered 100% Per-Broker SELLING activity
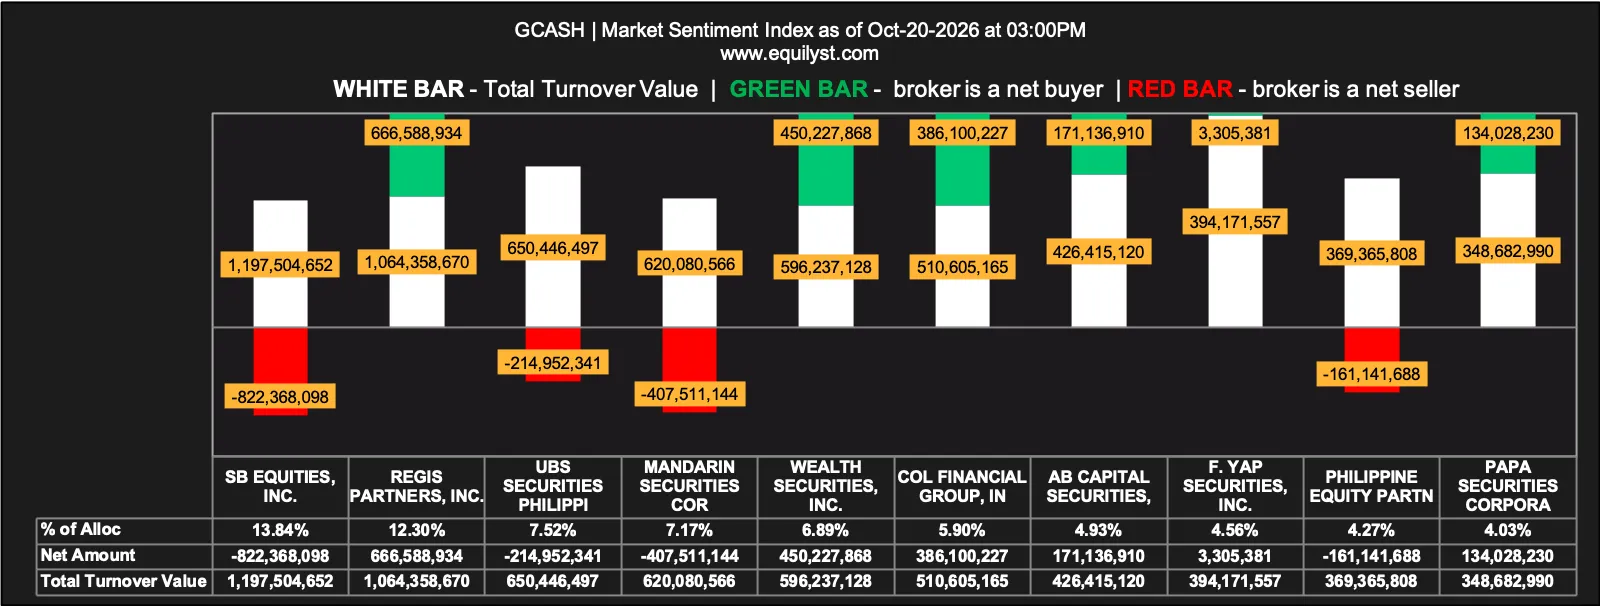
The bearish Market Sentiment Index for GCASH reflects a market in which investors and traders are still testing the waters and gauging prevailing sentiment. Such behavior is common among newly listed IPO stocks, particularly during their first three days to one week of trading on the Philippine Stock Exchange.
With limited trading history available, market participants are still determining an acceptable price for GCASH shares. The resulting uncertainty can produce conflicting buying and selling signals as investors assess the stock’s valuation and short-term prospects.
Overall Technical Analysis Assessment
It is premature to adopt a definitive bearish or bullish stance on GCASH after only its first day of trading on the Philippine Stock Exchange.
Whether you are a long-term investor or a short-term trader, one consideration takes precedence over whether you favor fundamental analysis over technical analysis, or vice versa: staying within a level of risk that you can tolerate both emotionally and financially.
Consider using a trailing stop-loss instead of relying solely on a fixed stop-loss. A trailing stop-loss adjusts upward as the stock price rises, helping preserve accumulated gains while maintaining a predefined level of downside protection. Depending on the chosen trailing distance and the stock’s subsequent price movement, it can help secure profits without requiring the investor to continually reset a fixed stop-loss manually.
A fixed stop-loss, by contrast, remains at its predetermined price unless manually adjusted. If the stock continues to rise, the fixed stop-loss does not automatically move upward to protect a greater portion of the accumulated gains.
However, a trailing stop-loss does not guarantee a particular selling price or eliminate risk. If the stock price falls to the trailing stop level, the resulting order may execute below that level, particularly in a fast-moving or illiquid market.
Ultimately, the objective is not to predict every price movement correctly. As I always remind my clients and followers at Equilyst Analytics, the goal is to preserve capital, protect gains, and prevent unbearable losses.
GCASH: Fundamental and Technical Verdict
Mynt enters the public market with an established digital financial services platform, substantial customer reach, and demonstrated profitability. However, first-half 2026 results show that net income growth lagged revenue growth, slightly reducing its net profit margin. At its IPO price of ₱6.60, its implied P/E ratio of 20.4 times annualized first-half earnings also reflects considerable growth expectations.
From a technical perspective, GCASH’s first trading session presents a more cautious near-term picture. The stock reached an intraday high of ₱6.76 before surrendering its gains and closing at ₱6.60. Its closing price below the VWAP of ₱6.6529, bearish Dominant Range Index, and bearish Market Sentiment Index point to selling pressure and uncertainty during this initial price-discovery period.
For the next trading session, ₱6.60 serves as immediate intraday support, while ₱6.66 represents resistance. A move above ₱6.62 on significant trading volume could increase the likelihood of revisiting ₱6.66 and potentially reaching ₱6.70. However, the bearish readings of both proprietary indicators warrant caution until stronger buying activity emerges.
Taken together, the analyses reveal a contrast between Mynt’s long-term business potential and GCASH’s near-term market behavior. Its established customer base, profitability, and expanding financial services support a cautiously constructive fundamental outlook. Nevertheless, the first session’s price action suggests that the stock has yet to establish a convincing bullish direction.
Fundamental analysis helps determine whether GCASH’s valuation is justified by its earnings and growth prospects, while technical analysis helps identify potential trading opportunities. Regardless of the approach, investors should establish a financially and emotionally tolerable level of risk. Trailing stop-loss orders may help preserve gains as prices rise, although execution at the intended level is not guaranteed.
GCASH’s first trading day marks only the beginning of its public-market history. Subsequent financial results and price action will reveal whether Mynt’s fundamental strengths can translate into sustained share-price appreciation.