In this report, I’d like to feature the Dominant Range Index of the 5 MOST ACTIVE STOCKS as of the time of writing this report.
The Dominant Range Index is one of the six indicators that compose the trading and investing methodology I teach to those who subscribe to my stock market consultancy service.
Why Did I Create My Dominant Range Index Indicator?
If you’re new to my website, I’m sure you don’t know yet what this Dominant Range Index is.
My proprietary technical indicator reads whether the stock’s dominant range is bearish or bullish depending on whether the price points that got the biggest volume and highest number of trades are closer to the intraday high or low.
If a stock’s Dominant Range Index rating is bullish, the price points that got the biggest volume and highest number of trades are closer to the intraday high than the intraday low.
In short, the price action’s sentiment supports the price’s upward direction.
On the other hand, a bearish Dominant Range Index’s bias is on the downtrend.
Some brokers only present the stock’s most voluminous prices but not the most traded prices.
It has to be both to isolate cross-trades from your price-volume-trade analysis.
If the price point got 50% of the traded volume but only 1% of the traded shares, wouldn’t you suspect something fishy happened at that price point?
Wouldn’t you even suspect someone tried to create an artificial buying or selling commotion at that price point?
The same is true when the percentage of traded shares is too far from the percentage of traded volume for a particular price point.
I was not saying the percentage of traded volume and shares must be equal, but they should not be significantly far from each other to meet a certain state of equilibrium.
My clients and I benefit a lot from my strategy of identifying the dominant range whether we’re in a buying or selling mode. Buy or sell within the dominant range because that’s the spot where your trade has the highest chance of getting a match.
I can tell you more about the entirety of my strategy when you subscribe to my stock market consultancy service.
Now, I’ll show you the Dominant Range Index rating for the following stocks as of the time of writing (my charts have timestamps) in this freemium report.
Ayala Land
Dominant Range Index: BULLISH
Last Price: 26.2
VWAP: 26.33
Dominant Range: 26.4 – 26.4
SM Prime Holdings
Dominant Range Index: BULLISH
Last Price: 32.6
VWAP: 32.76
Dominant Range: 32.65 – 32.95
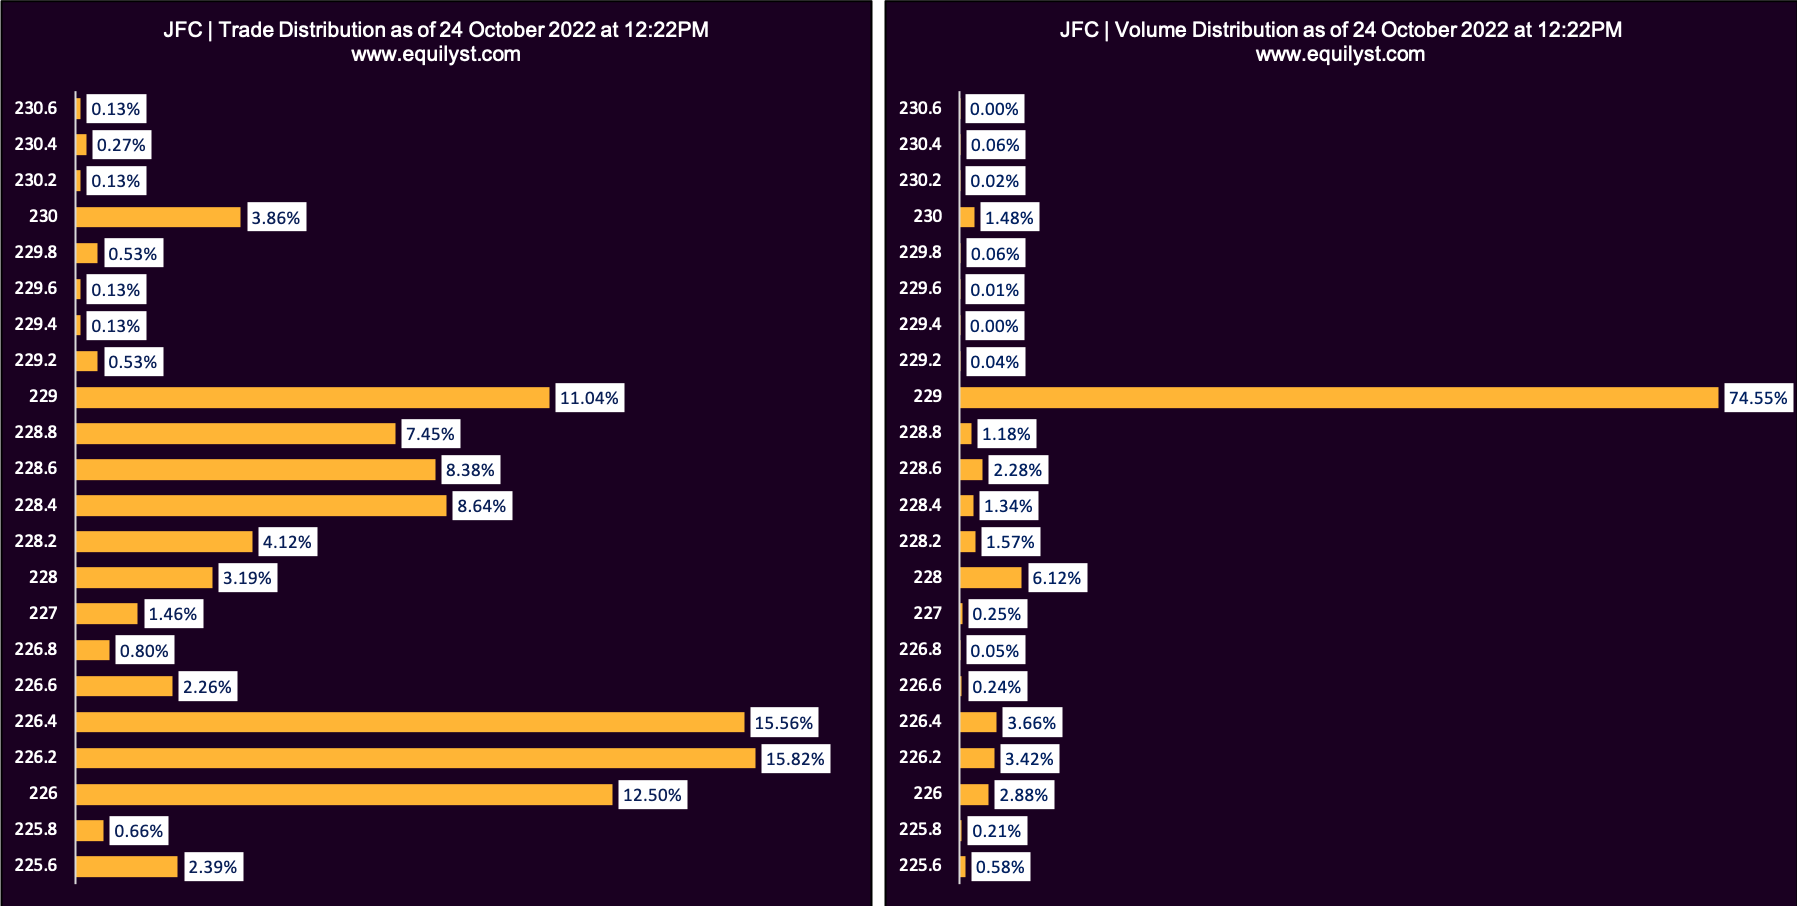
Jollibee Foods Corporation
Dominant Range Index: BEARISH
Last Price: 226
VWAP: 228.61
Dominant Range: 226.2 – 229
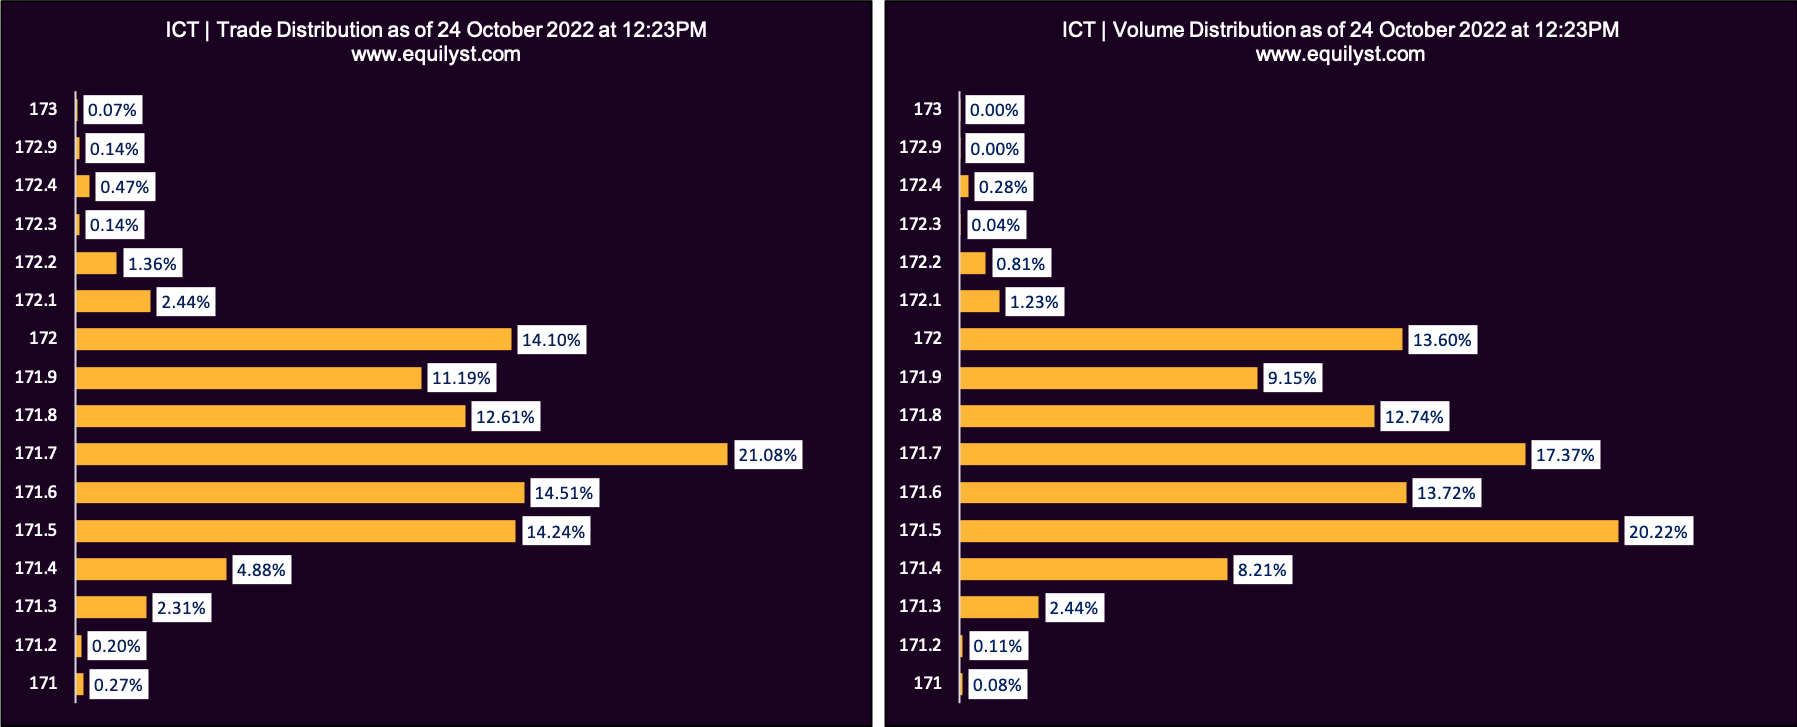
Int’l Container Terminal Services
Dominant Range Index: BEARISH
Last Price: 171.7
VWAP: 171.69
Dominant Range: 171.5 – 171.7
Semirara Mining and Power Corporation
Dominant Range Index: BEARISH
Last Price: 41.4
VWAP: 41.49
Dominant Range: 41.5 – 41.5
Insightful?
Go ahead and share this free report with anyone you know who trades or invests in the Philippine stock market.
If you want to hire me as a personal mentor in stock trading and investing, subscribe to my stock market consultancy service.
- MA, BDO, ALI, URC, PX: Is Their Dominant Range Pointing to a Breakout? - March 14, 2025
- Tracking Market Sentiment: MTD Ratings for 30 Bluechip Stocks (March 2025) - March 13, 2025
- PSEi Stalls Below 6,260 as Market Awaits Political Shift - March 12, 2025


