SP New Energy Corporation (SPNEC) Price Structure Overview
SP New Energy Corporation (SPNEC) closed on February 16, 2026 at ₱1.33 per share, up 4.72%, supported by a modest Net Foreign Buying of nearly ₱3 million. The positive price action, coupled with foreign participation, signals renewed buying interest in the short term.
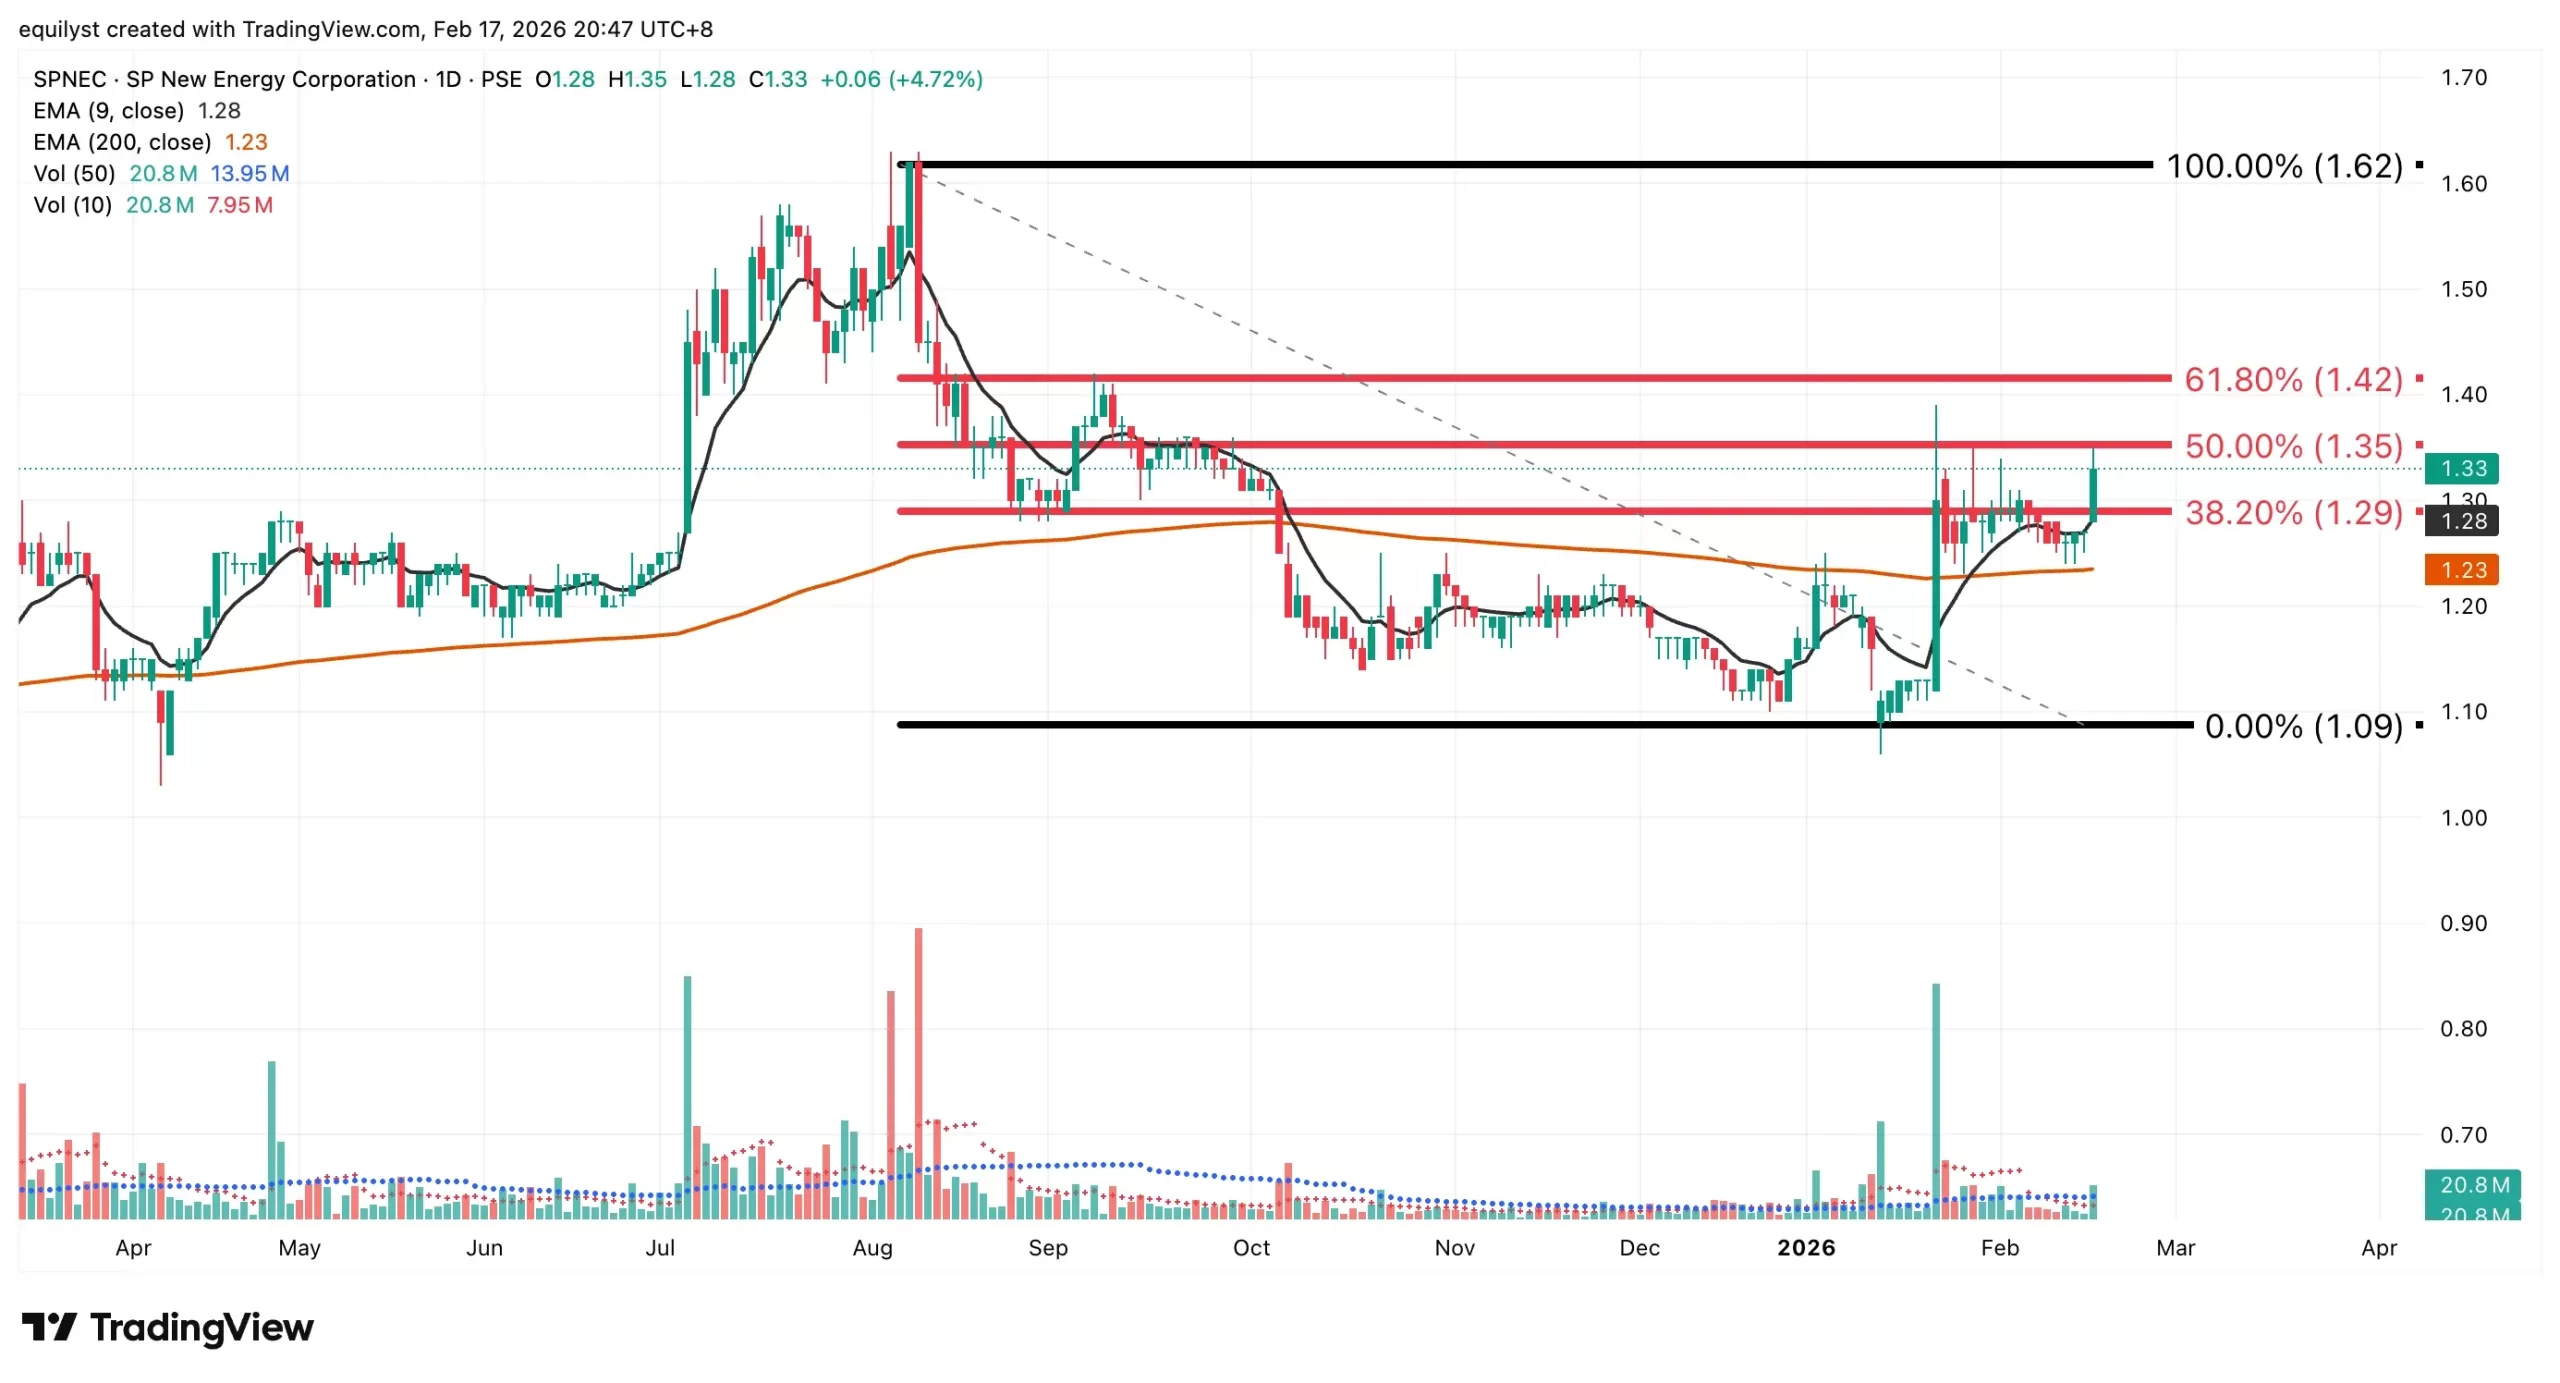
SPNEC is currently trading above both its 9-day and 200-day exponential moving averages, and notably, the short-term average is hovering above the long-term average. This alignment reflects constructive momentum and typically characterizes a developing bullish structure. When short-term price strength sustains above long-term trend support, market control shifts in favor of buyers.
However, historical behavior introduces an important technical consideration. SPNEC has repeatedly changed direction whenever price enters the 50% to 61.80% Fibonacci retracement band. In September 2025, price transitioned into a corrective phase after touching this retracement zone. Now, in February 2026, SPNEC is once again testing the 50% Fibonacci retracement, placing the stock at a technically sensitive area.
This zone has historically acted as a decision band rather than a breakout platform. While the current trend structure appears bullish, prior reactions at this retracement level suggest that supply may emerge if momentum weakens. If short selling were more active in the local market, this would be an especially compelling level to monitor as price challenges historically reactive territory.
Immediate support is located near ₱1.09, while resistance stands between ₱1.35 and ₱1.42, defining the upper boundary of the current advance.
Volume Confirmation
The most recent volume bar exceeded 100% of both SPNEC’s 10-day and 50-day volume averages, validating the strength behind the latest upward move. Elevated volume during price advances confirms participation and reduces the likelihood of a weak or unsustainable rally.
When price rises above key moving averages with strong volume confirmation, the move carries structural weight. However, because SPNEC is approaching a historically reactive Fibonacci band, sustained volume will be required to decisively overcome resistance.
Dominant Range Index: BULLISH
Last Price: ₱1.33
Dominant Range: ₱1.31 – ₱1.33
VWAP: ₱1.3187
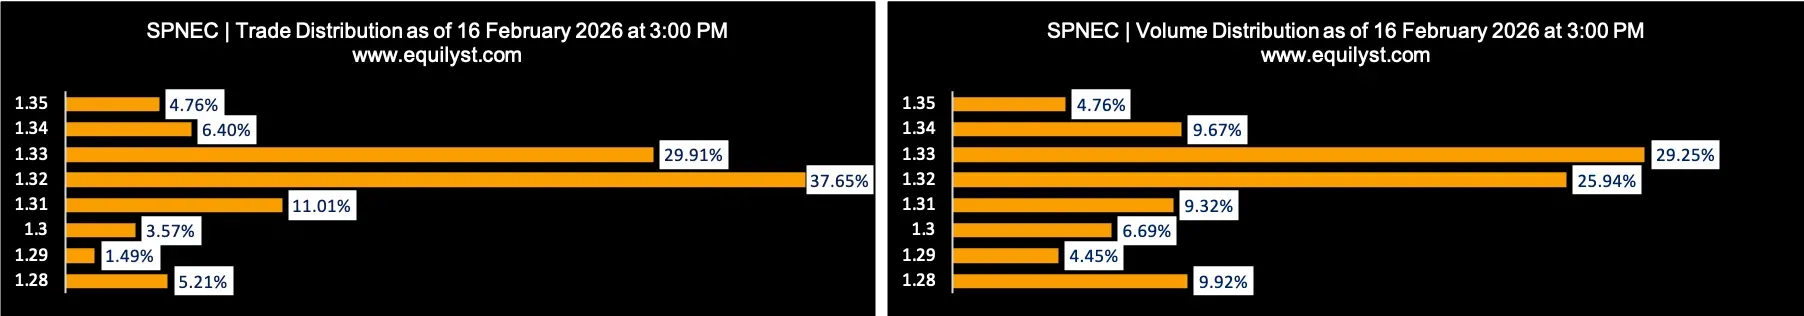
The Dominant Range Index registers BULLISH, with the dominant range positioned closer to the intraday high than the intraday low. This placement indicates that the majority of transactions occurred near the upper boundary of the session.
Additionally, the closing price sits above the VWAP of ₱1.3187, suggesting that buyers were willing to transact at progressively higher prices throughout the session. This pattern reflects sustained intraday demand rather than a late-session spike.
In isolation, the Dominant Range Index supports the continuation of upward momentum.
Market Sentiment Index: BEARISH Divergence
16 of 41 brokers (39.02%) posted a positive Aggregate Net Amount
16 of 41 brokers (39.02%) posted a higher Per-Broker Buying Average than Selling Average
Aggregate Buying Average: ₱1.31906
Aggregate Selling Average: ₱1.32444
6 brokers (14.63%) registered 100% BUYING activity
16 brokers (39.02%) registered 100% SELLING activity
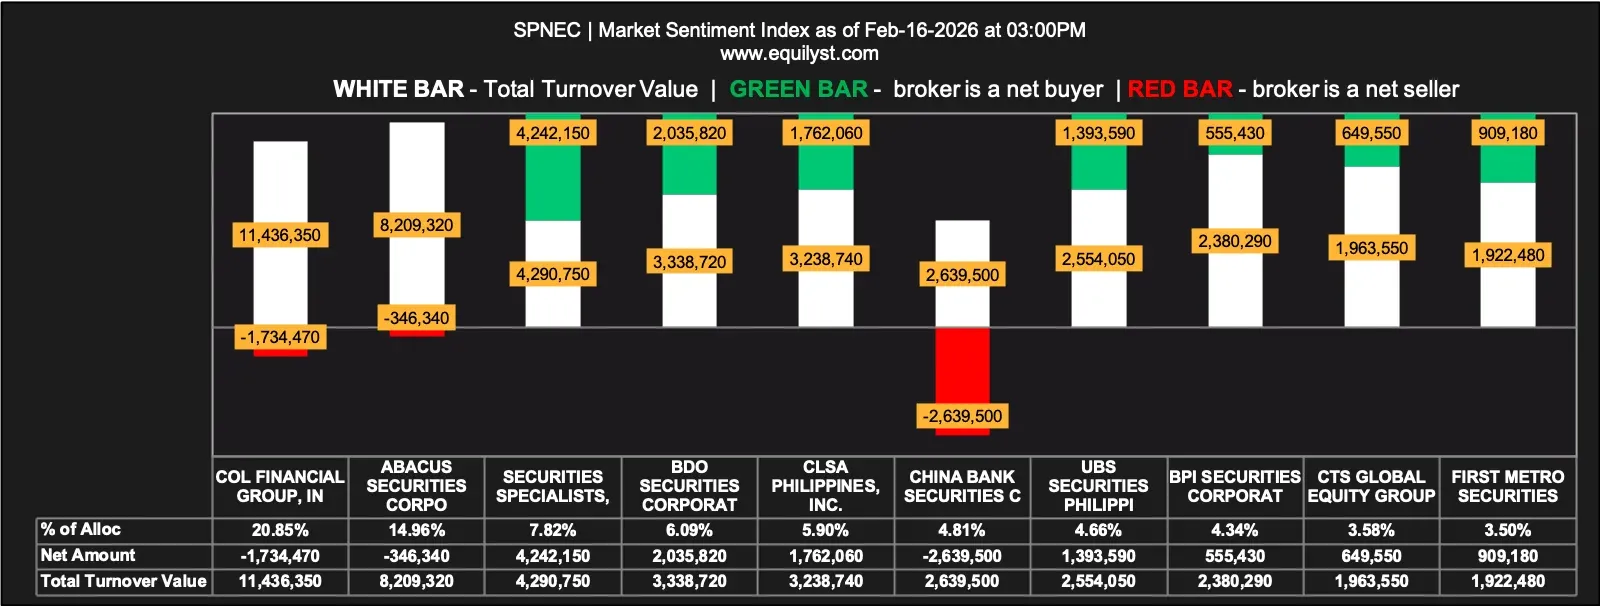
Despite bullish price action and a constructive Dominant Range Index reading, the Market Sentiment Index prints BEARISH, creating a meaningful divergence.
Less than 40% of participating brokers ended net buyers, and only 14.63% registered pure buying activity, while 39.02% registered pure selling activity. Although this does not represent a majority of participants, pure sellers clearly outnumber pure buyers. Furthermore, the aggregate selling average exceeds the aggregate buying average, indicating that sellers were able to transact at slightly higher prices.
This divergence suggests that while price is advancing, broker-level conviction is not broadly aligned with the move. The rally may be driven by selective participants rather than widespread institutional accumulation.
Such configurations often precede either:
- A continuation breakout fueled by concentrated buying pressure, or
- A near-term pullback if supply overwhelms limited demand near resistance.
The Market Sentiment Index introduces caution into what would otherwise appear to be a straightforward bullish setup.
Consolidated Outlook
SPNEC currently exhibits a bullish structural alignment:
- Price trades above both short-term and long-term exponential moving averages.
- The short-term average hovers above the long-term average.
- Volume expansion validates the recent upward move.
- The Dominant Range Index confirms intraday buying control.
However, this strength collides with key technical and participation constraints:
- Price is testing the historically reactive 50% Fibonacci retracement.
- The 50% to 61.80% Fibonacci band has previously marked reversal zones.
- Resistance lies between ₱1.35 and ₱1.42.
- The Market Sentiment Index reflects broker-level distribution rather than accumulation.
The synthesis of these signals suggests that SPNEC is in a technically strong position but approaching a decisive inflection point. A breakout above ₱1.35–₱1.42 with sustained volume and improving broker participation would confirm continuation. Failure to overcome the Fibonacci band may result in a pullback toward lower support levels, with ₱1.09 as the next major reference point.
For now, momentum favors the bulls, but the reaction at the Fibonacci decision band will determine whether this move evolves into a sustained advance or another historical reversal.
If you want to know more about this stock’s behavior and potential market moves, reach out to us through the contact form below.