Price Structure and Trend Context
If you zoom out on the price chart of San Miguel Corporation (SMC), a clear downtrend channel has been in place since the stock reached its all-time high in May 2019. A recovery attempt emerged in October 2025 near ₱56, but the advance stalled again in the first week of January 2026 after encountering resistance at ₱86.00.
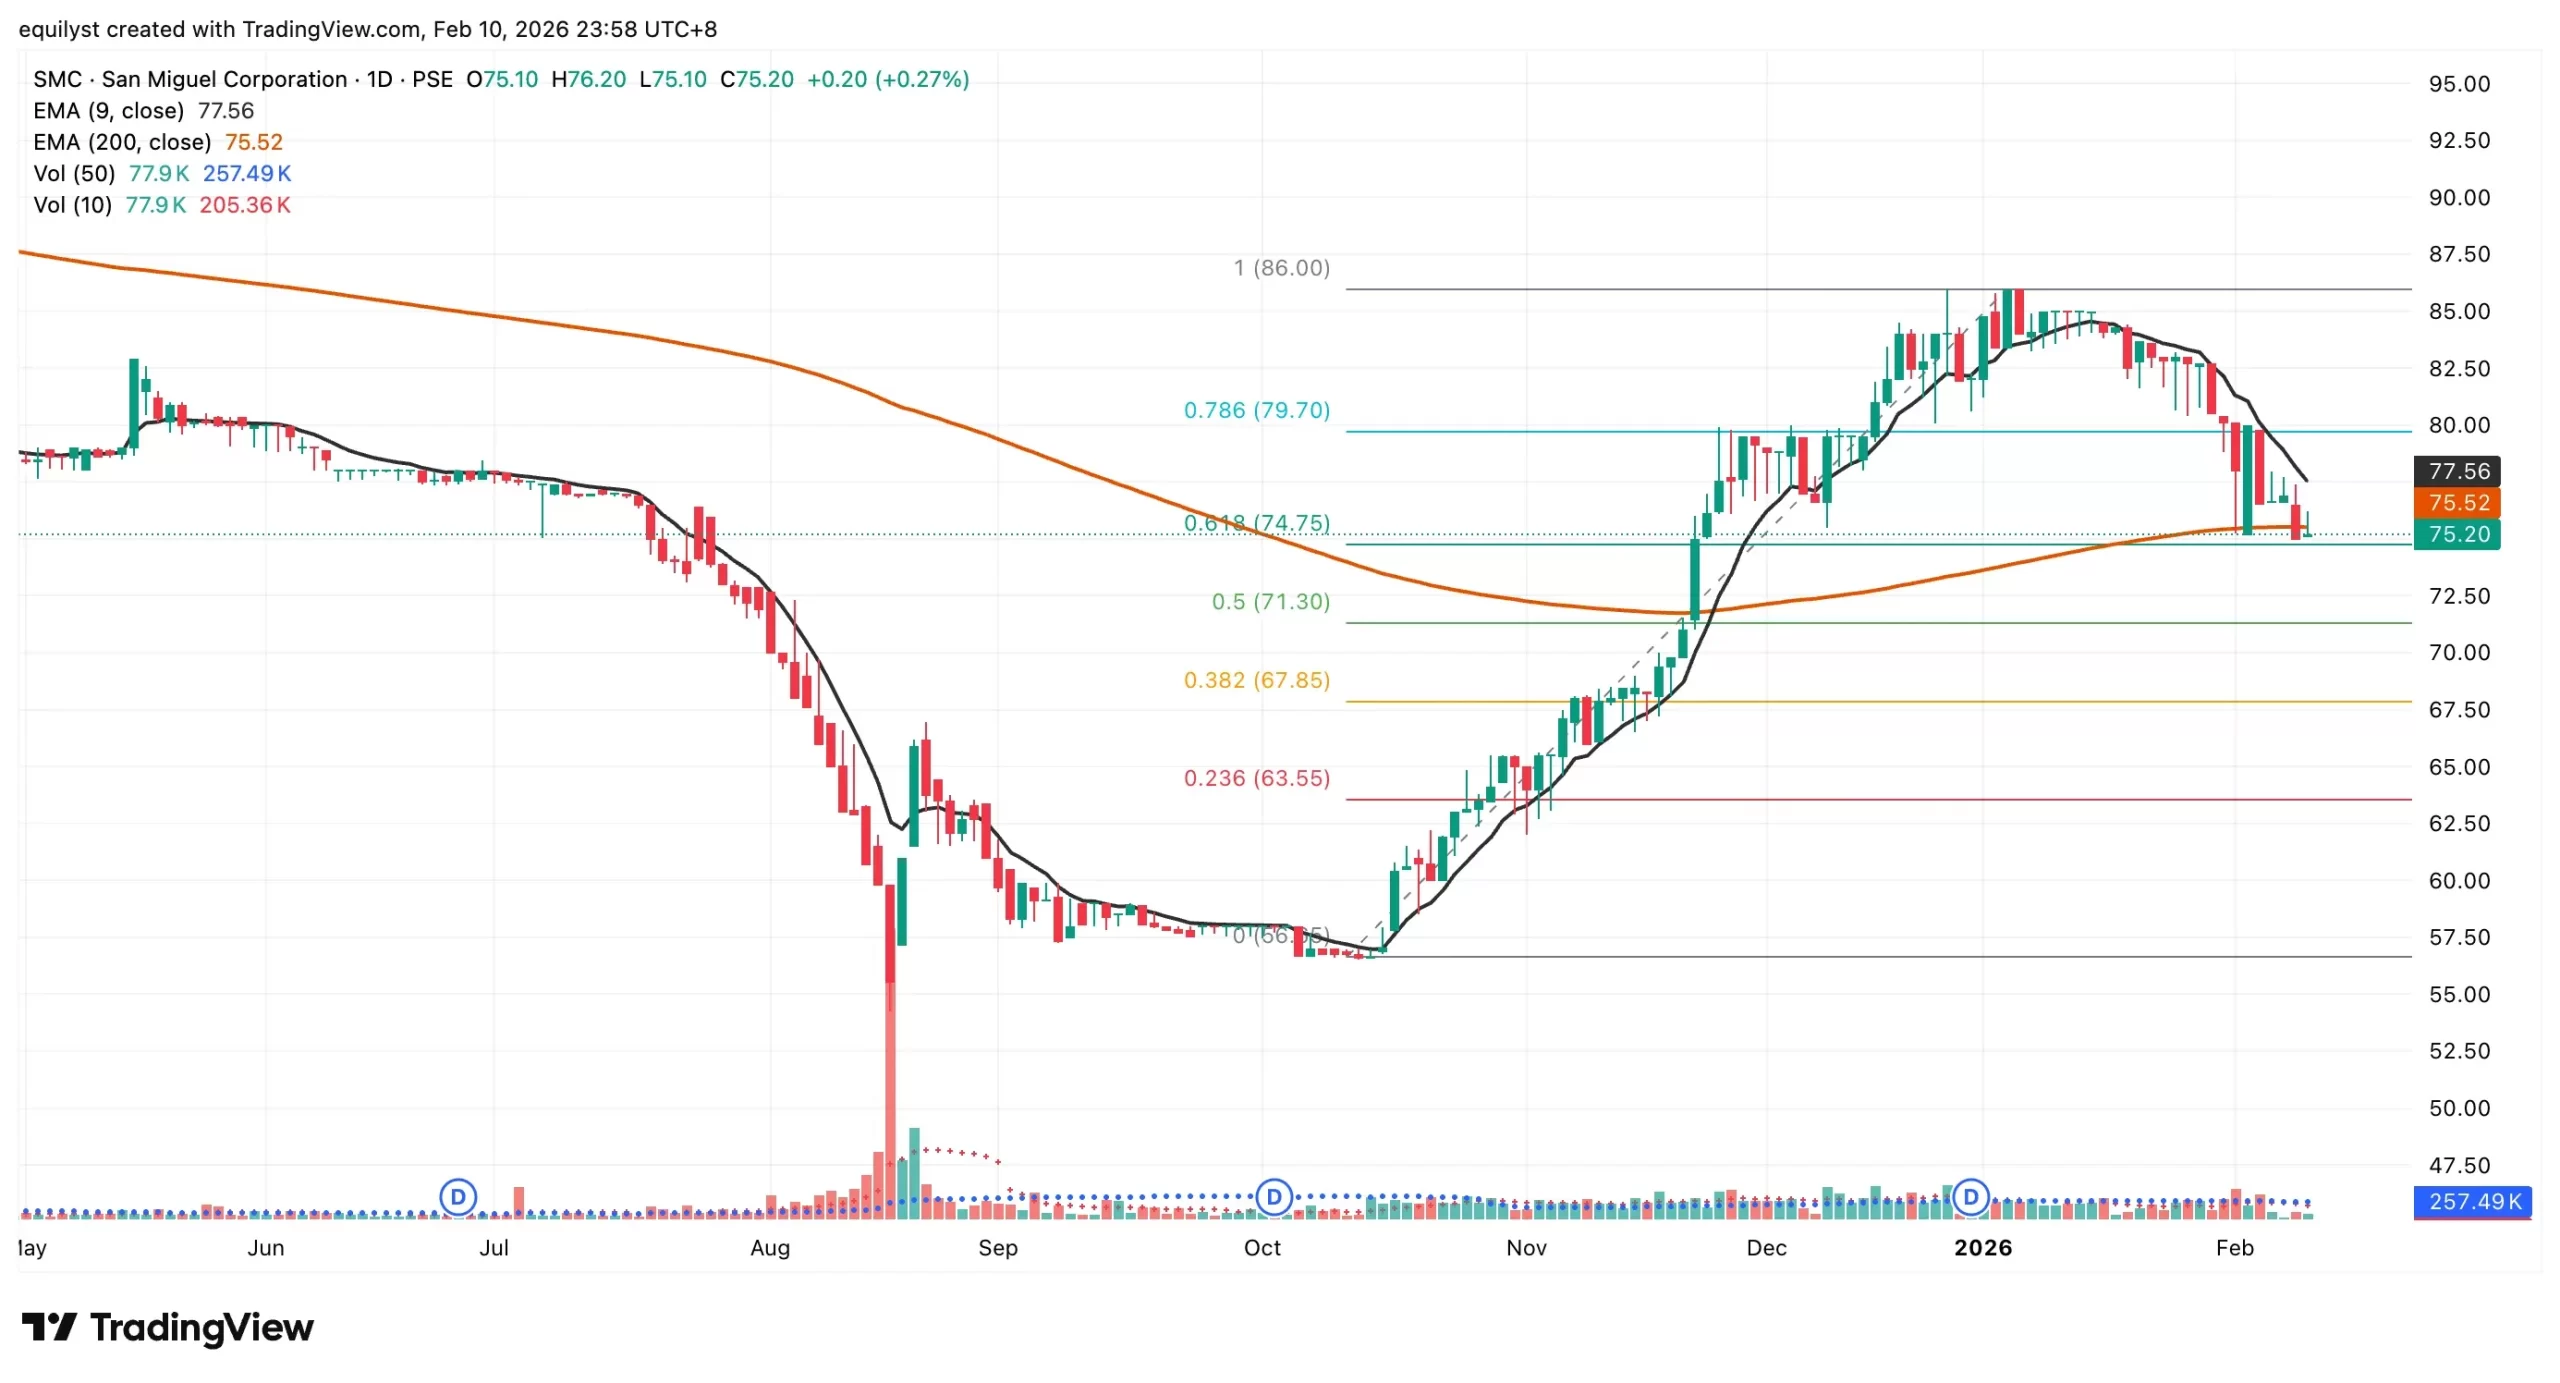
On February 10, 2026, SMC closed at ₱75.20, up 0.27%. Despite the positive day change, the stock continues to trade below both its 9-day EMA and 200-day EMA, keeping the short-term and long-term technical bias bearish.
Key Support and Resistance Levels
Immediate support is located near ₱74.75, aligned with the 61.8% Fibonacci retracement. Immediate resistance is found at ₱79.60, aligned with the 78.6% Fibonacci retracement.
A break below ₱74.75 would shift downside focus toward ₱71.30, the 50% Fibonacci retracement. On the upside, a sustained move above ₱79.60 would reopen the path toward ₱86.00.
Reward-to-Risk Considerations
From a reward-to-risk perspective, the current setup may appear attractive when measured against nearby support and resistance levels. However, proximity alone does not justify an entry. A more disciplined approach requires confirmation from both the Dominant Range Index and the Market Sentiment Index. Bullish alignment across these indicators would provide stronger, data-driven confidence to initiate or add to a position.
Volume and Participation Conditions
That confirmation remains absent. The latest positive day change came with only about 38% of SMC’s 10-day volume average, signaling weak participation. Without volume expansion, near-term price strength risks fading rather than developing into a sustained move.
Dominant Range Index Assessment
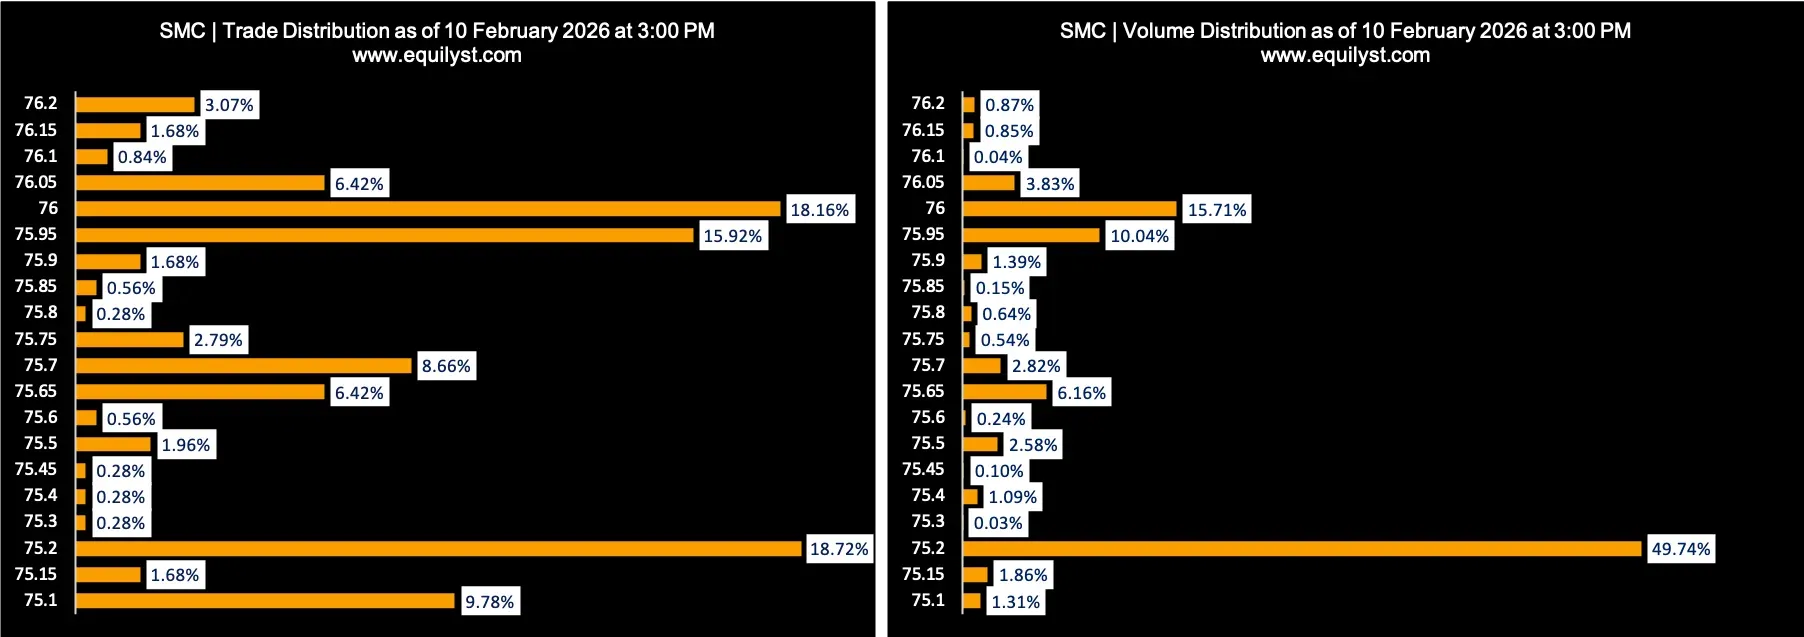
SMC registered a bearish Dominant Range Index, reinforcing the caution implied by thin volume. While another active range appeared near ₱75.95–₱76.00, analytical weight is placed on the range closest to the closing price with the highest volume and trade count. In this session, the ₱75.10–₱75.20 range carries greater significance.
Dominant Range Index: BEARISH
Last Price: 75.20
Dominant Range: 75.10 – 75.20
VWAP: 75.5189
Market Sentiment Index Perspective
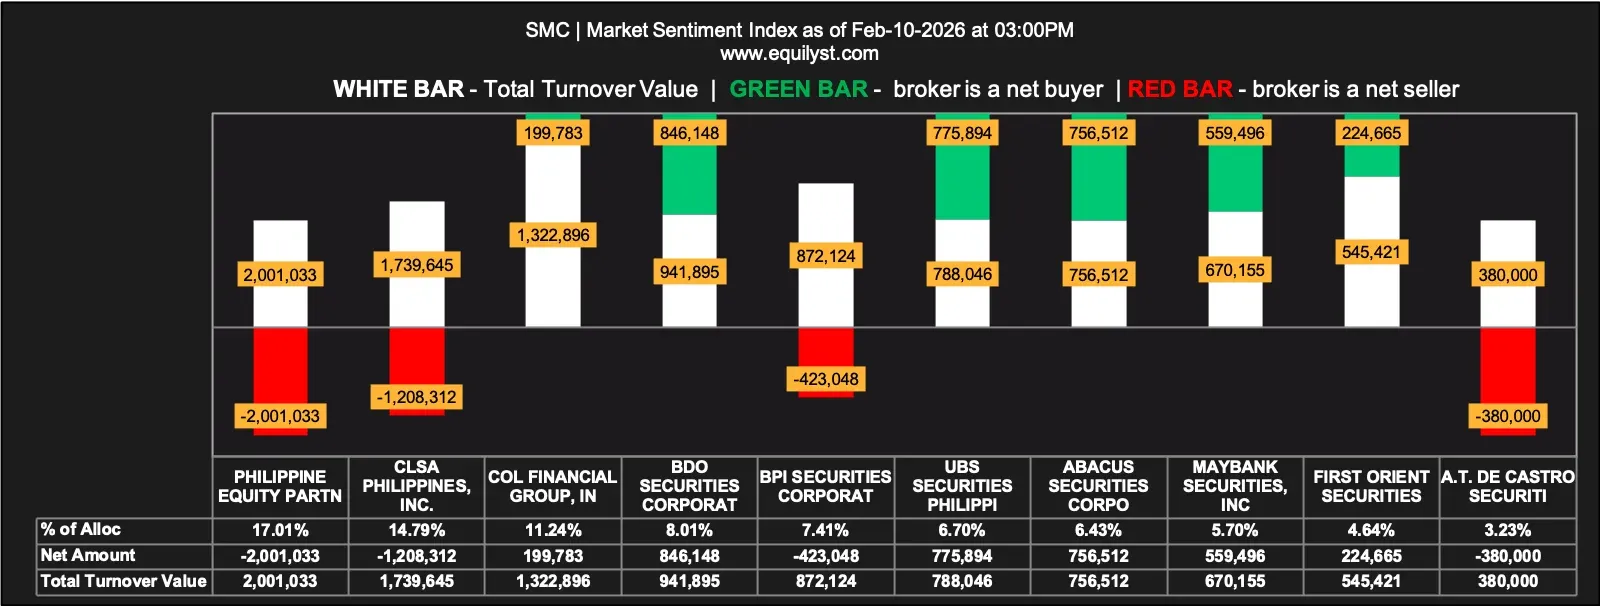
The Market Sentiment Index printed a bullish reading, suggesting that a majority of participating brokers treated the session as a buying opportunity. However, this indicator does not account for volume intensity. Notably, the aggregate selling average remains higher than the aggregate buying average, which tempers the optimism implied by headline sentiment.
Market Sentiment Index: BULLISH
16 of the 25 participating brokers, or 64.00%, posted a positive Aggregate Net Amount
16 of the 25 participating brokers, or 64.00%, posted a higher Per-Broker Buying Average than Per-Broker Selling Average
Aggregate Buying Average: ₱75.53804
Aggregate Selling Average: ₱75.69996
8 of 25 participants, or 32.00%, registered 100% Per-Broker BUYING activity
5 of 25 participants, or 20.00%, registered 100% Per-Broker SELLING activity
Consolidated Outlook and Risk Framework
In the short term, SMC remains vulnerable to pullbacks as long as price stays below key moving averages and volume participation remains thin. Failed attempts to build momentum above current levels increase the risk of revisiting lower support zones.
In the long term, the broader downtrend structure remains intact. A meaningful shift in bias would require sustained closes above the 200-day EMA, supported by expanding volume and stronger broker-level conviction.
Additional context or structured review support may be requested through the consultancy form below.