SM Investments Corporation (SM) Price Context
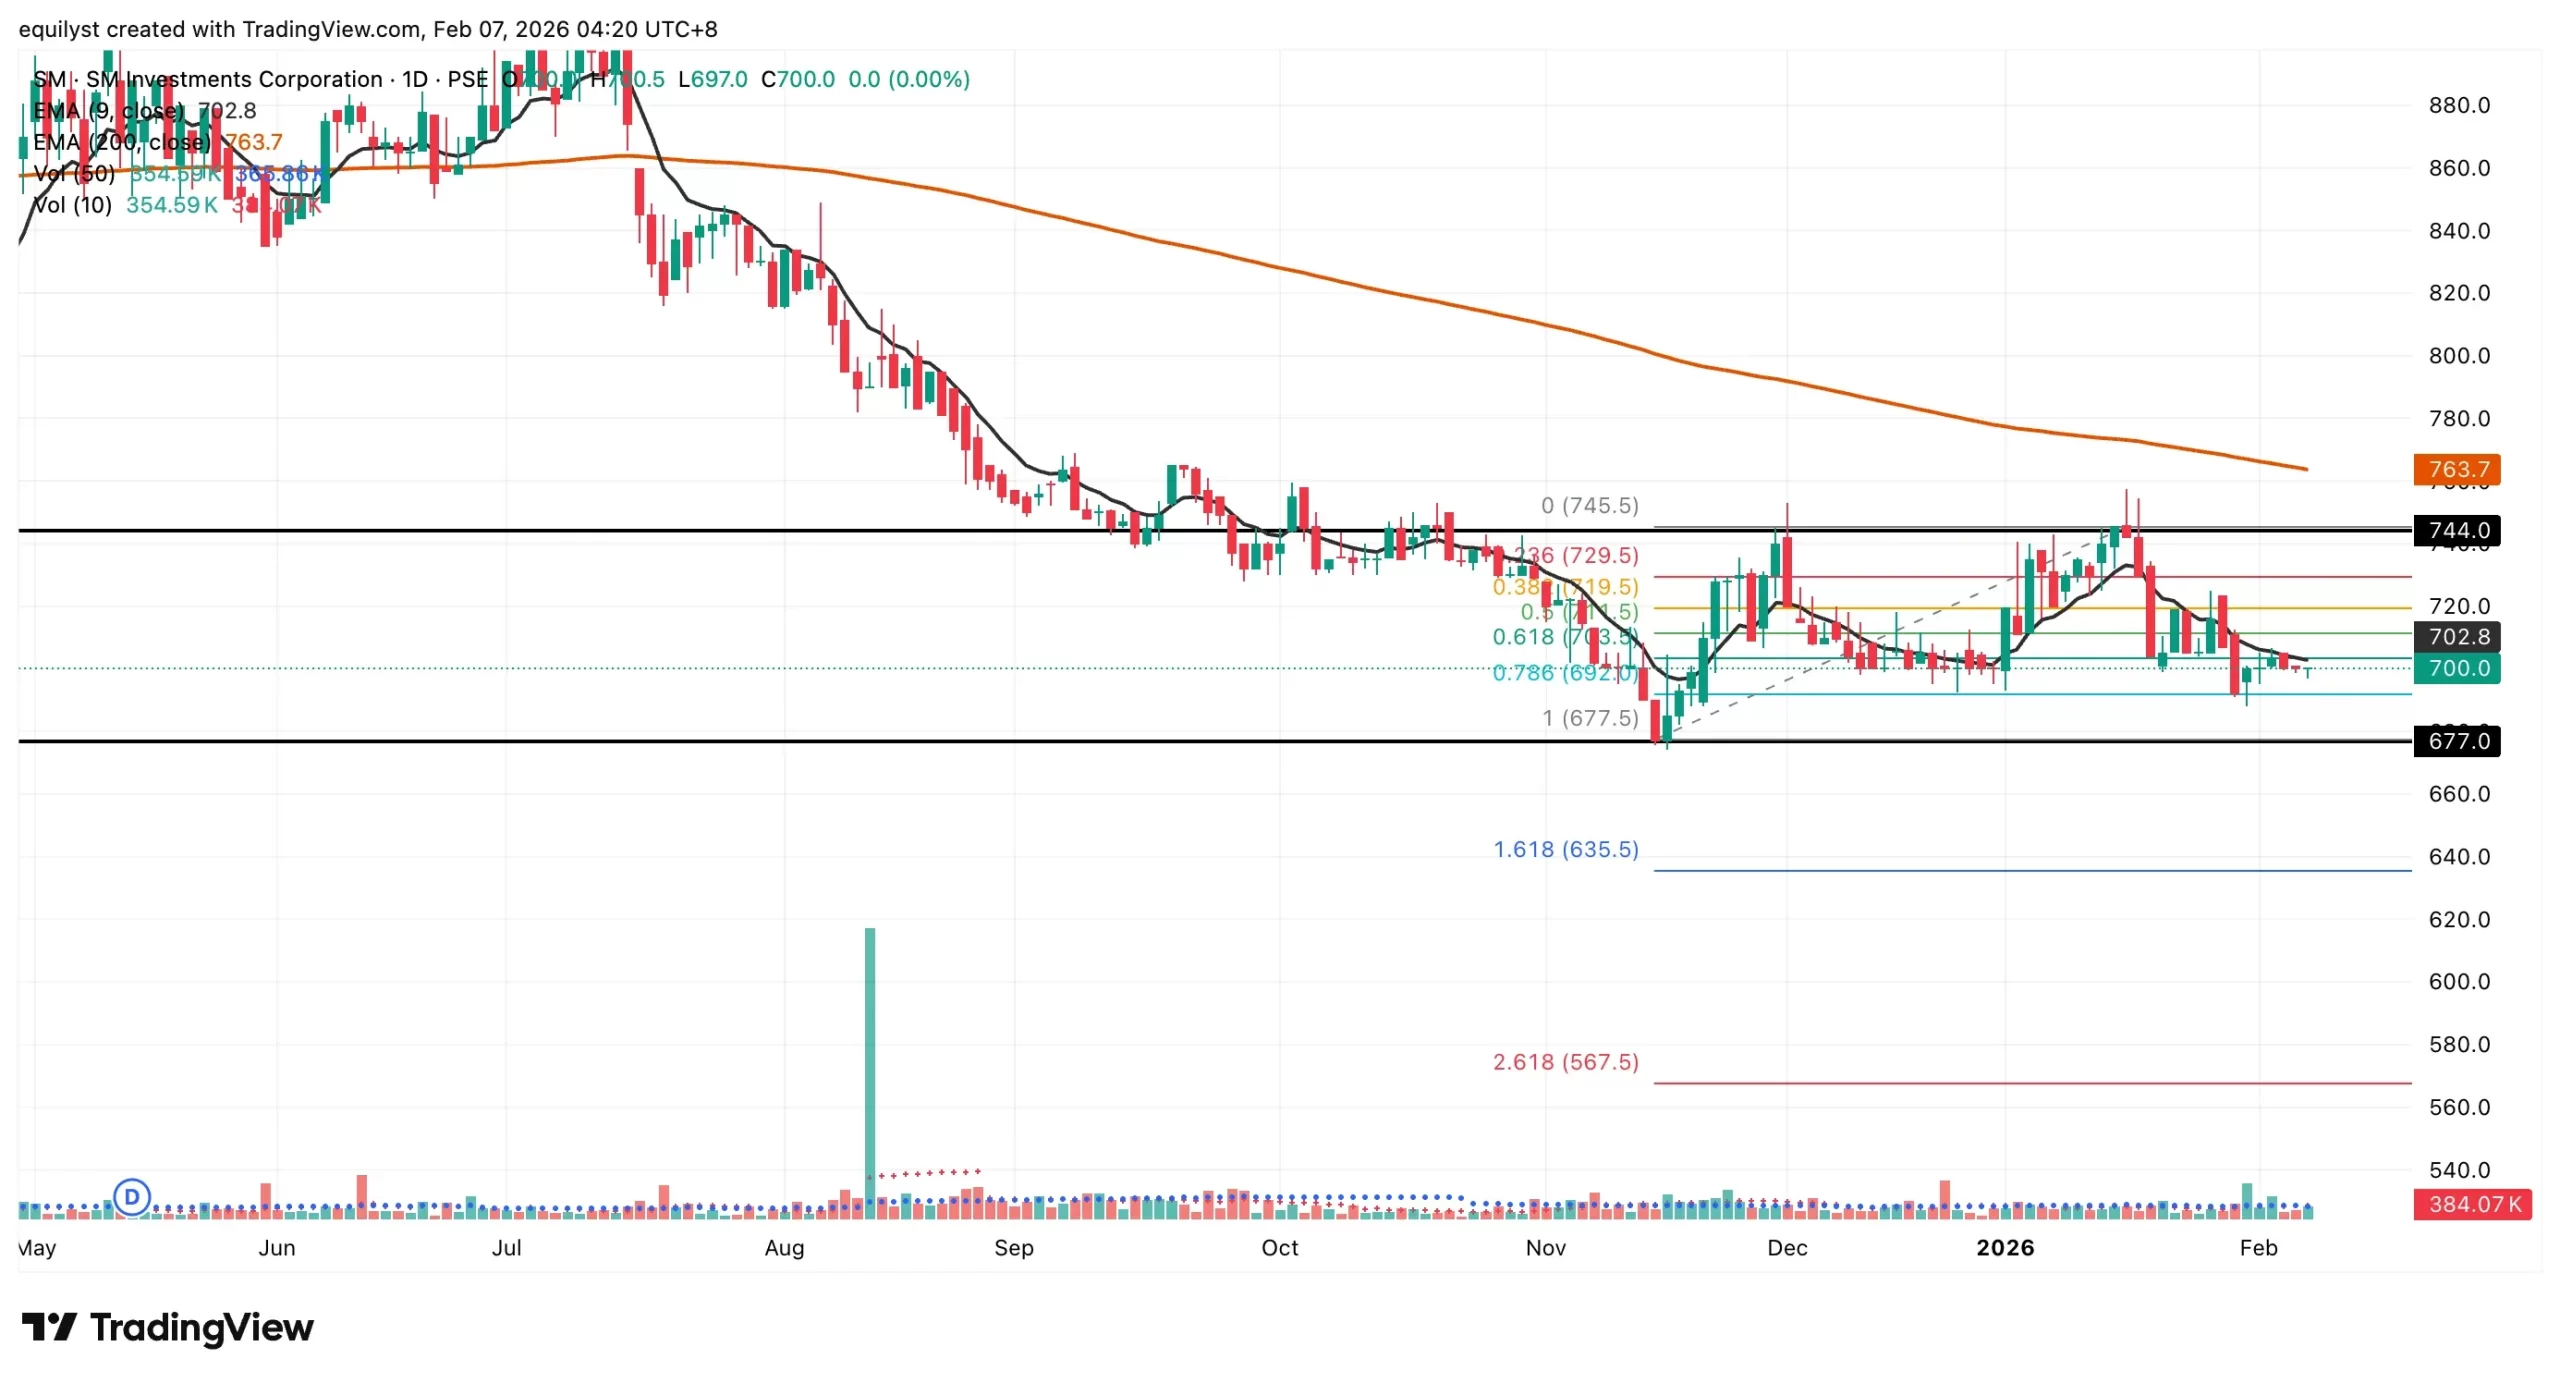
SM Investments Corporation (SM) closed the February 6, 2026 session at ₱700.00, unchanged for the day. The stock has remained confined within the ₱700 to ₱744 range for more than four months, reflecting a prolonged phase of balance rather than directional commitment.
Over the past week, price attempted to move beyond ₱703.50, aligned with the 61.8% Fibonacci retracement, but failed to sustain acceptance above this level. On the downside, ₱692.00, which coincides with the 78.6% Fibonacci retracement, continues to define the nearest structural support.
Trend Alignment and Volume Behavior
From a trend standpoint, SM remains technically weak across both horizons. Price continues to trade below the 9-day EMA, maintaining short-term pressure, while its sustained position below the 200-day EMA confirms the absence of long-term trend strength.
Volume behavior reinforces this lack of conviction. Over the past ten trading sessions, activity exceeded 100% of the 10-day volume average only three times, signaling hesitation among market participants and limited willingness to transact at higher levels.
Dominant Range and Intraday Positioning
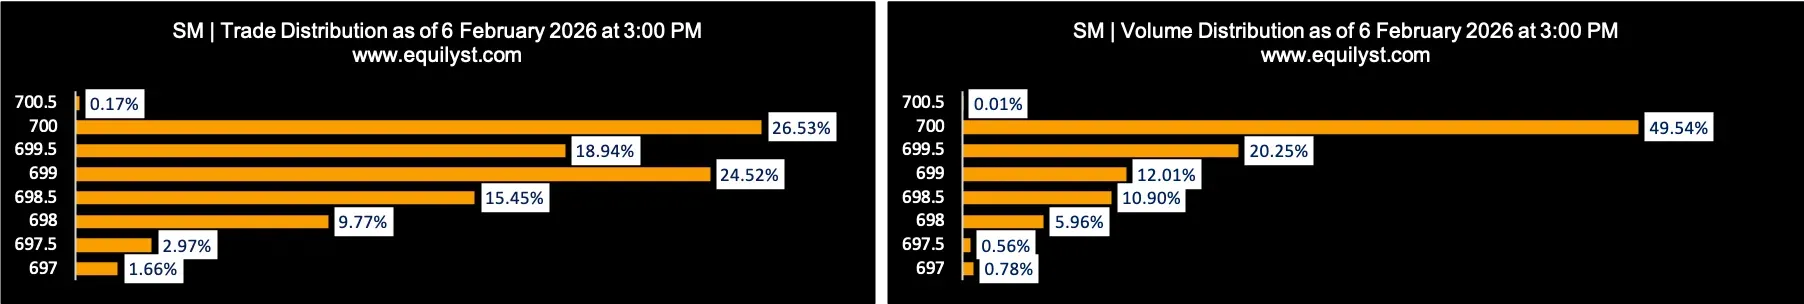
Despite weak trend alignment, SM registered a bullish Dominant Range Index. The price range that attracted the highest volume and trade count developed closer to the intraday high, and the closing price settled above the volume-weighted average price. This intraday structure suggests late-session buyer presence, even as broader confirmation remains absent.
Dominant Range Index: BULLISH
Last Price: 700
Dominant Range: 698 – 700
VWAP: 699.4586
Market Sentiment and Participation Metrics
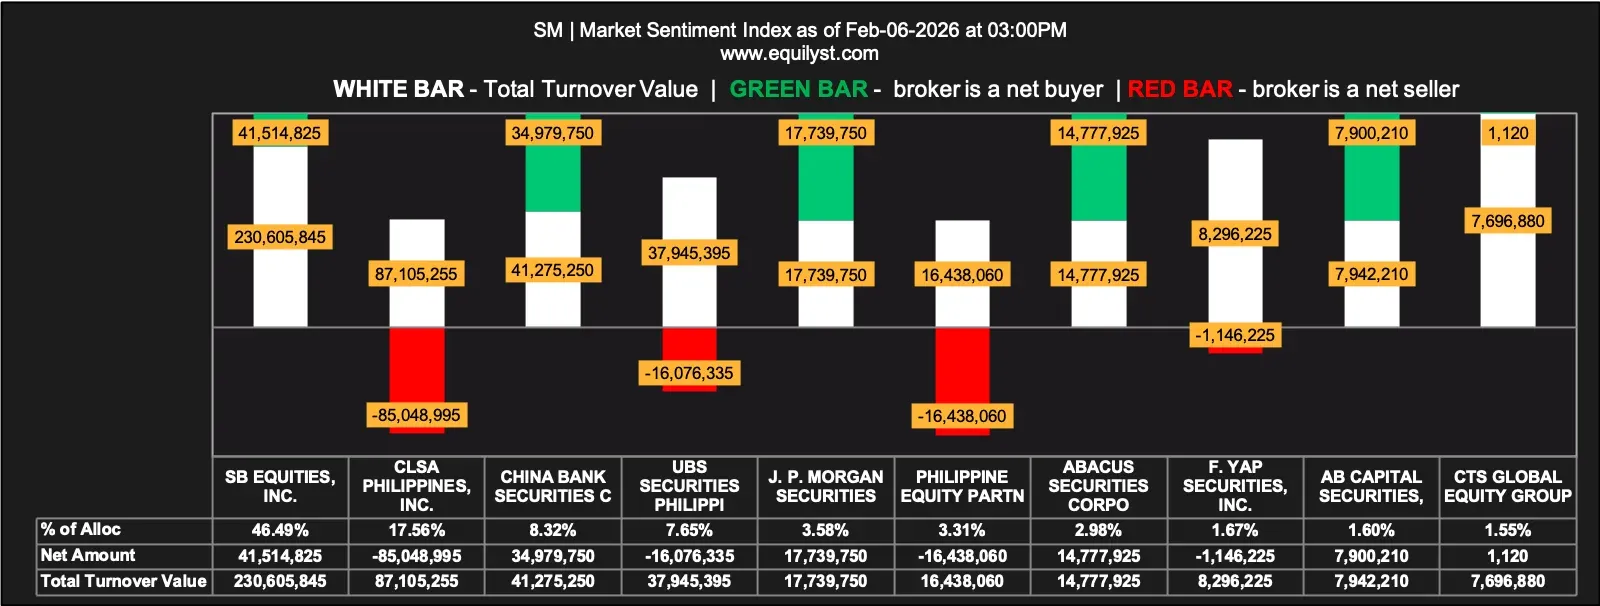
SM’s Market Sentiment Index issued a bearish reading, reflecting the imbalance between participation and execution quality across brokers.
Market Sentiment Index: BEARISH
19 of the 29 participating brokers, or 65.52% of all participants, registered a positive Aggregate Net Amount
14 of the 29 participating brokers, or 48.28% of all participants, registered a higher Per-Broker Buying Average than Per-Broker Selling Average
29 Participating Brokers’ Aggregate Buying Average: ₱698.99325
29 Participating Brokers’ Aggregate Selling Average: ₱699.46920
9 out of 29 participants, or 31.03% of all participants, registered a 100% Per-Broker BUYING activity
5 out of 29 participants, or 17.24% of all participants, registered a 100% Per-Broker SELLING activity
Consolidated Outlook and Risk Framework
SM remains within a well-defined consolidation phase, with indicators pointing to selective accumulation rather than a decisive shift in control. Intraday strength has yet to translate into sustained trend alignment or consistent participation.
Acceptance above ₱703.50, supported by improving volume behavior, would be necessary to reopen the upper boundary near ₱744.00. Failure to defend ₱692.00 would instead increase downside exposure within the existing range.
For long-term investors, emphasis remains on risk containment and level discipline. Until price reclaims alignment with its long-term moving average, positioning decisions may continue to prioritize capital preservation over directional conviction.
Additional context or structured review support may be requested through the consultancy form below.