
JGS Summit Holdings (JGS) Price Action Overview
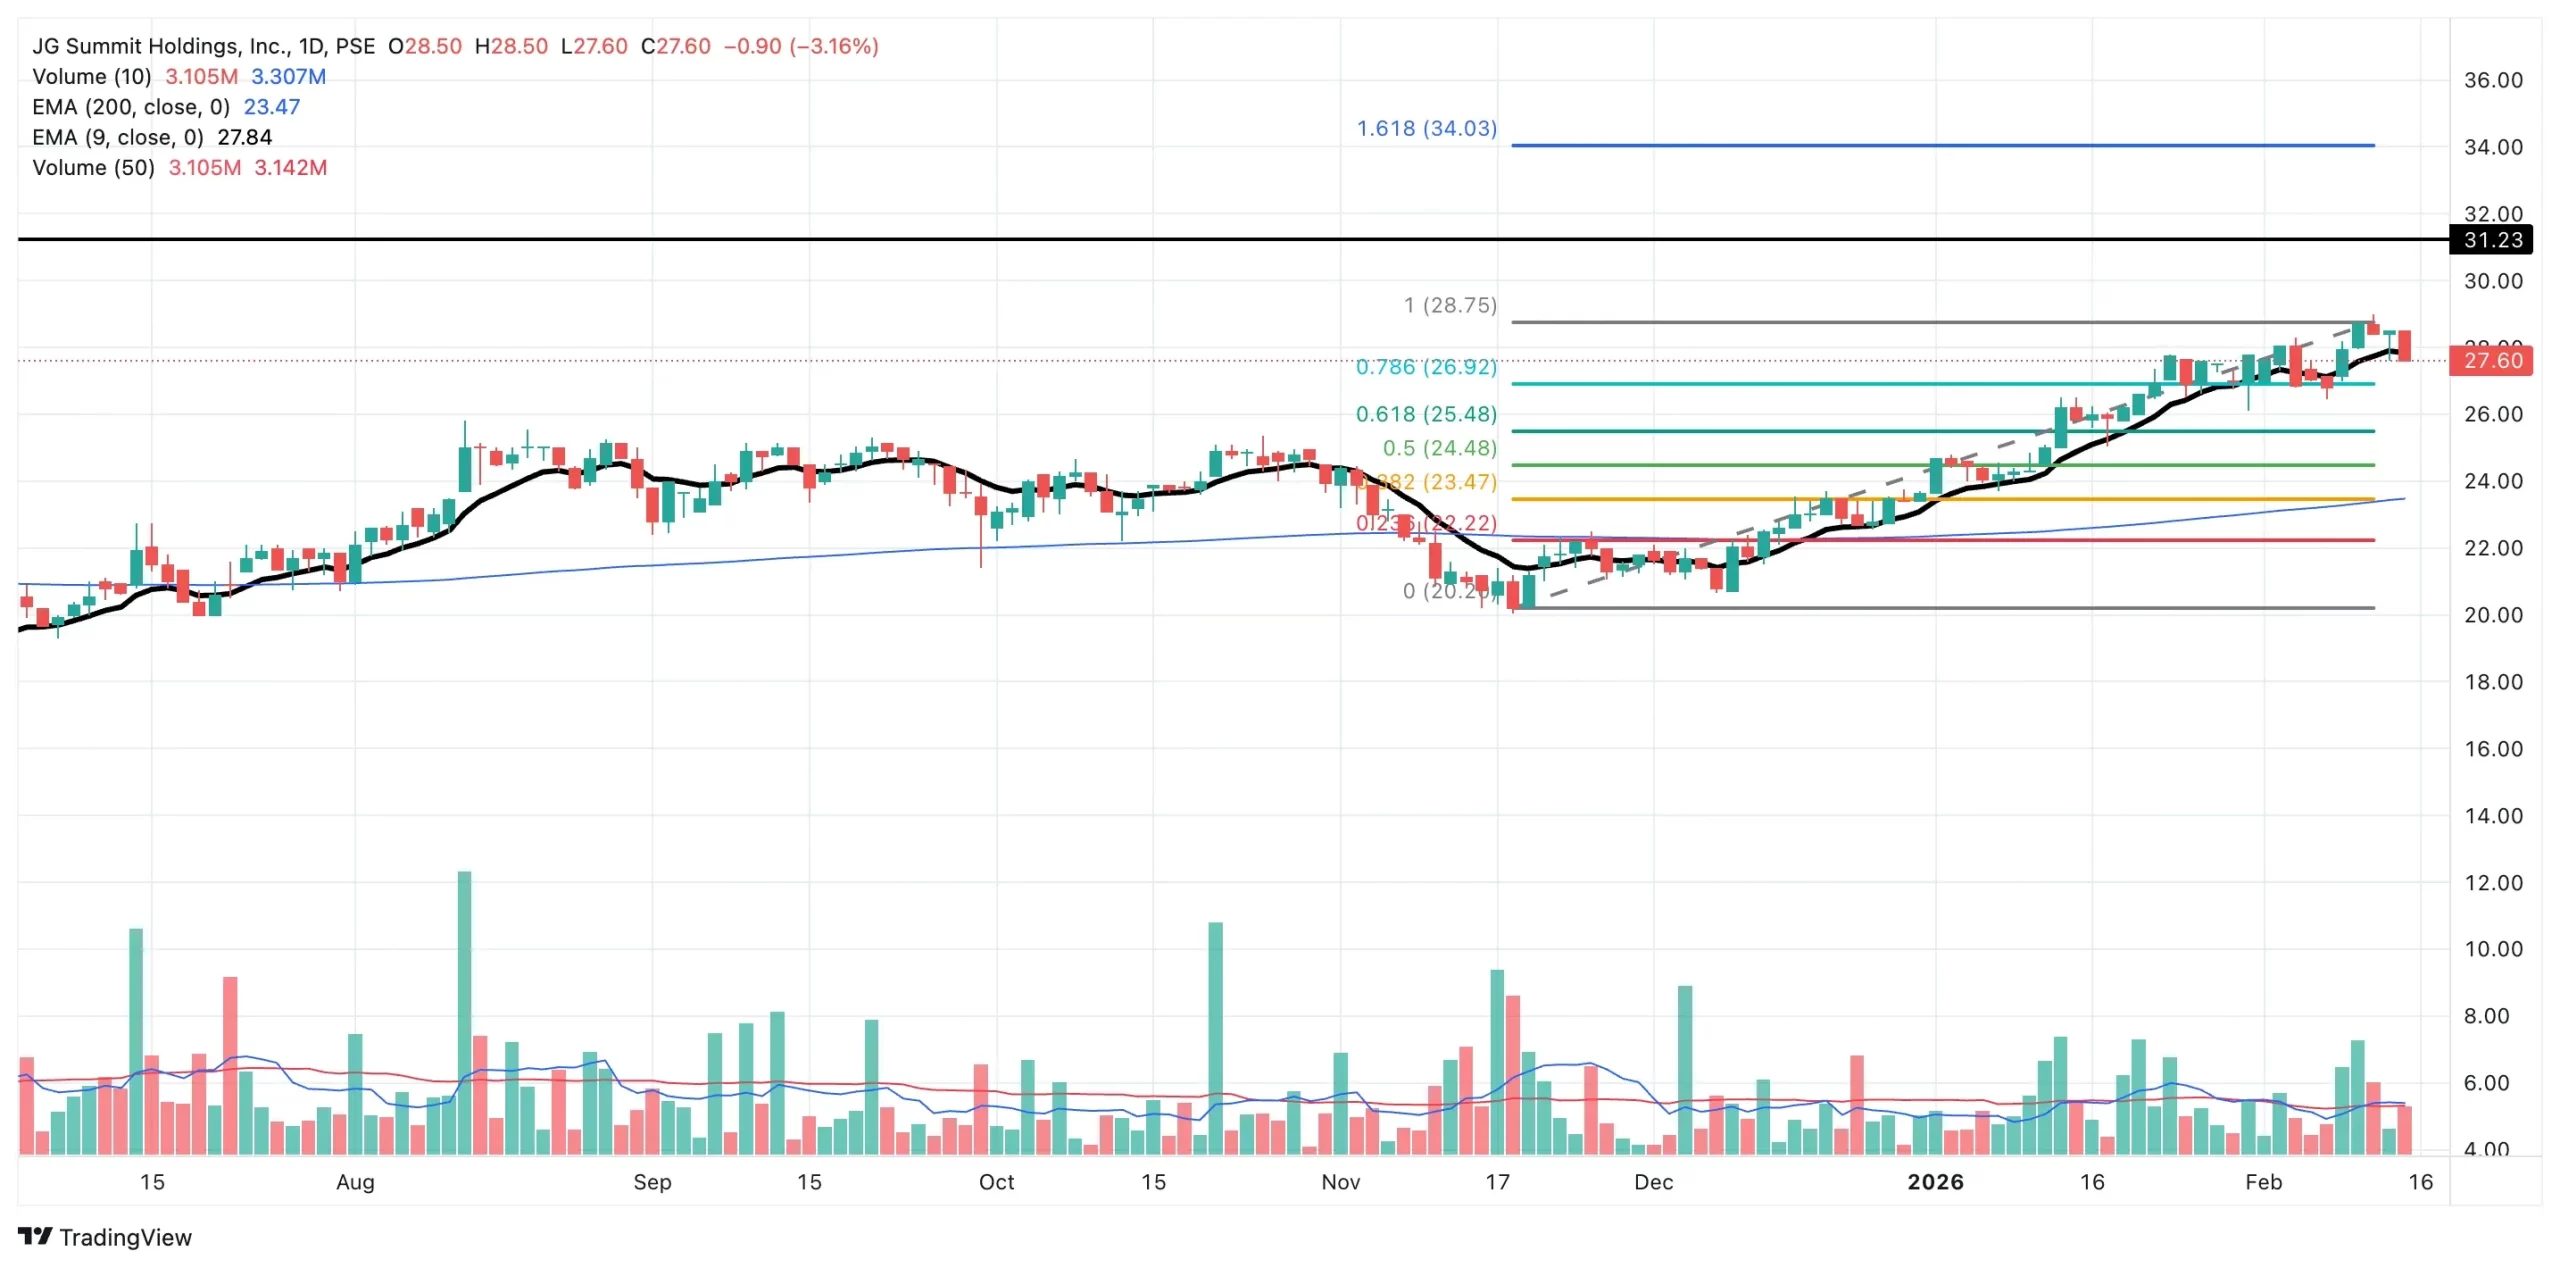
JGS Summit Holdings (JGS) is still up 11.75% year-to-date, reflecting a strong start to 2026. However, the stock appears to have encountered significant resistance at ₱28.75, where upward momentum stalled. As of February 13, 2026, JGS closed at ₱27.60, down 3.16%, despite registering Net Foreign Buying worth ₱9.6 million.
The immediate support level is at ₱25.50 (61.8% Fibonacci retracement), serving as the first technical cushion should selling pressure persist. A deeper support level is seen at ₱23.50 (32.8% Fibonacci retracement). On the upside, resistance remains firm at ₱28.75, with a breakout potentially opening the path toward ₱31.20.
From a trend perspective, JGS has been trading within its long-term uptrend guided by the 200-day EMA since December 11, 2025, indicating that the broader structure remains constructive. However, today’s decline pushed the stock slightly below its 9-day EMA, albeit by less than 1%, suggesting short-term momentum has weakened but not fully reversed.
Volume nearly reached 100% of both its 10-day and 50-day averages, meaning the 3.16% decline was backed by substantial participation. This is significant because price movements supported by strong volume tend to carry more conviction. The selloff was not merely due to thin liquidity—it reflected active repositioning by market participants.
Dominant Range Index: BEARISH
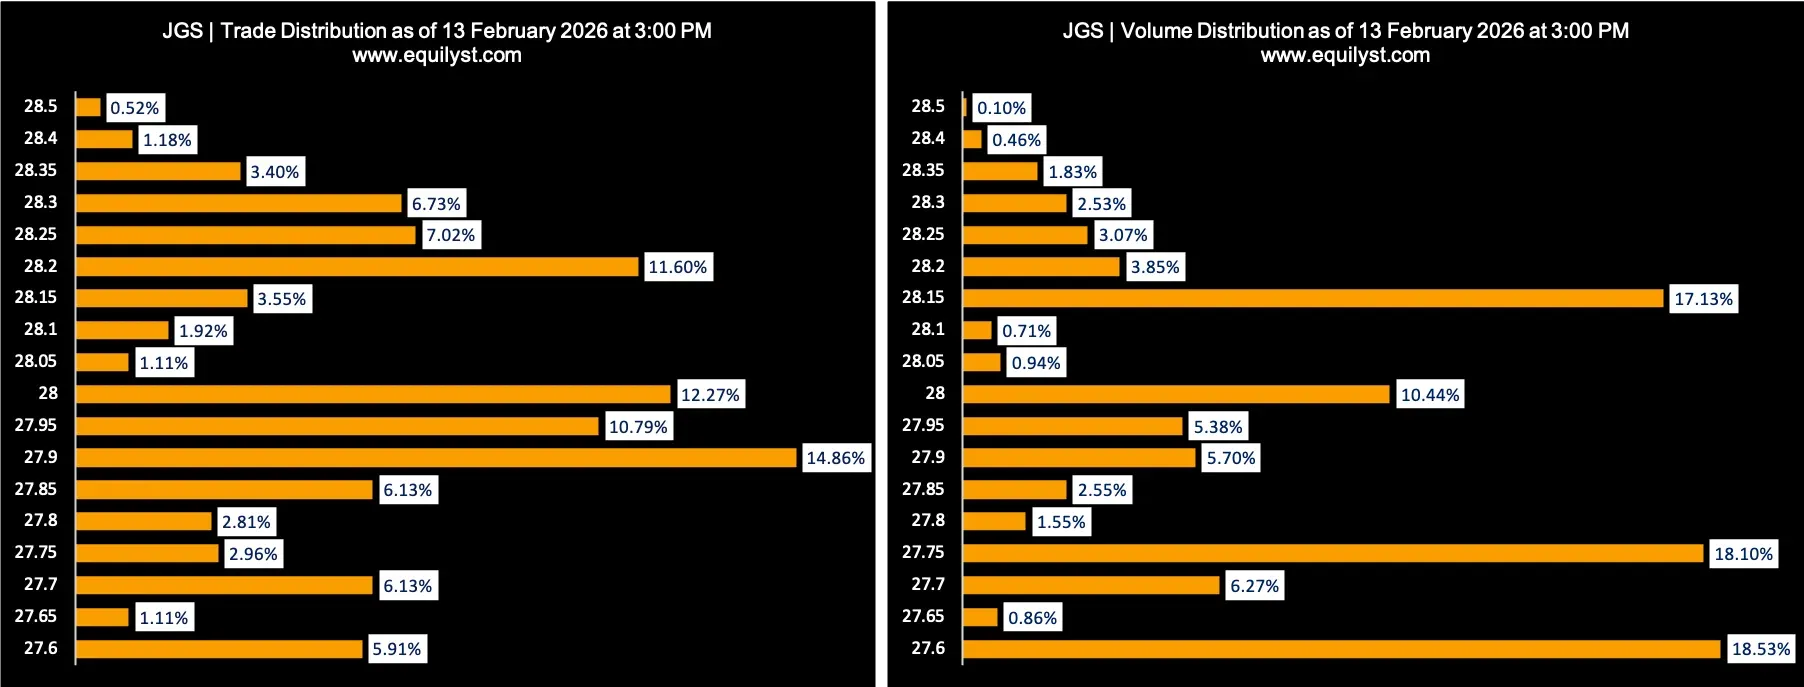
Last Price: ₱27.60
Dominant Range: ₱27.60 – ₱28.00
VWAP: ₱27.9021
The Dominant Range Index is BEARISH because the dominant trading cluster formed closer to the intraday low than the intraday high. Although the range extended up to ₱28.00, sustained trading gravitated toward the lower boundary near ₱27.60, where the stock ultimately closed.
The fact that the last price sits at the lower edge of the dominant range reinforces the bearish intraday bias. Meanwhile, the VWAP at ₱27.9021 remains noticeably above the closing price, indicating that a significant portion of transactions occurred at higher levels earlier in the session. As the day progressed, sellers gradually took control and pushed prices lower.
This structure suggests distribution rather than accumulation. Traders who entered near VWAP are currently at a slight disadvantage, which may create additional short-term selling pressure if price fails to reclaim the VWAP zone. The clustering of trades near the session low reflects persistent supply and signals that bullish momentum has temporarily weakened.
Market Sentiment Index: BULLISH
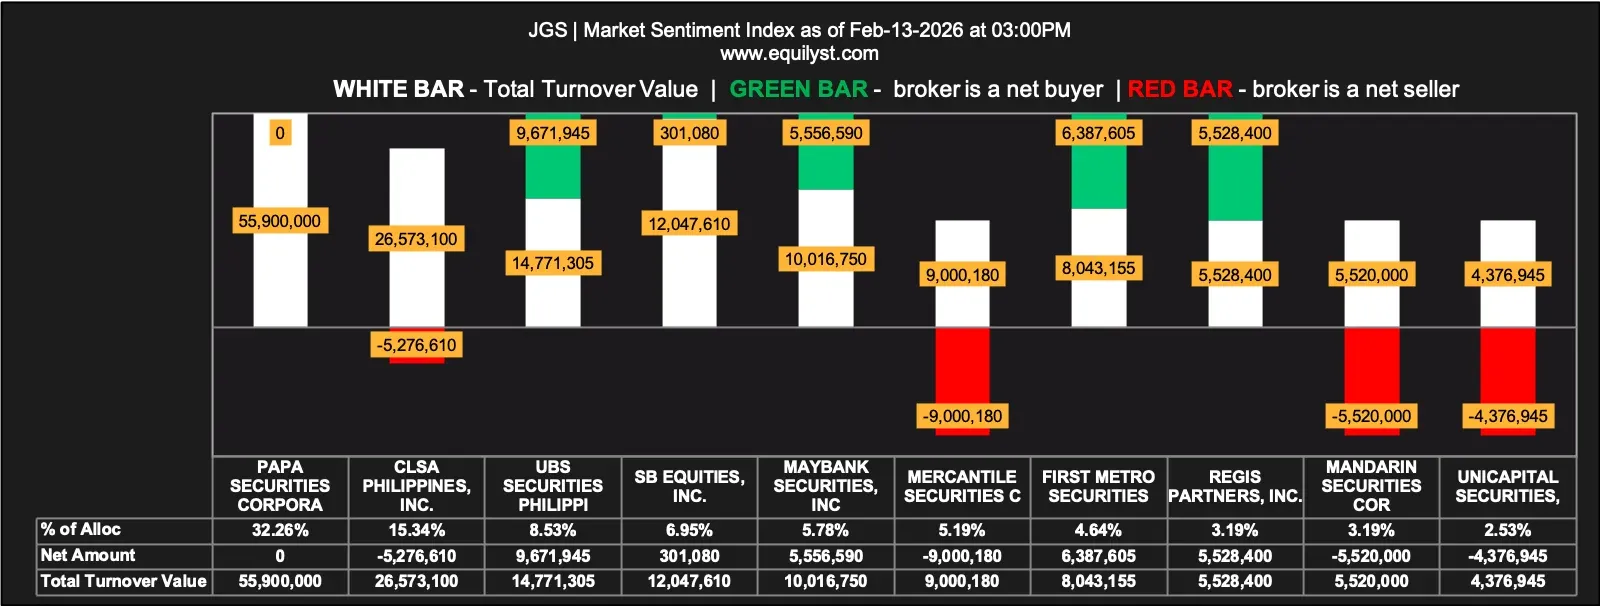
20 of 36 brokers (55.56%) posted a positive Aggregate Net Amount
20 of 36 brokers (55.56%) had a higher Per-Broker Buying Average than Selling Average
Aggregate Buying Average: ₱27.83536
Aggregate Selling Average: ₱27.93271
14 brokers (38.89%) registered 100% Per-Broker BUYING activity
7 brokers (19.44%) registered 100% Per-Broker SELLING activity
Despite the bearish intraday structure, the Market Sentiment Index is BULLISH, indicating broader broker-level participation remains constructive.
More than half of participating brokers accumulated shares on a net basis, and nearly 39% of brokers were purely buyers throughout the session, compared to only 19.44% purely sellers. This asymmetry suggests that while price declined, many participants viewed the pullback as an opportunity rather than a breakdown.
However, the aggregate selling average (₱27.93271) slightly exceeds the aggregate buying average (₱27.83536). This subtle divergence tempers the bullish interpretation, as it implies that sellers were able to transact at marginally higher prices on average. In other words, accumulation may have occurred, but sellers still dictated the pricing structure during the session.
The contrast between a bearish Dominant Range Index and a bullish Market Sentiment Index reveals a market in short-term conflict:
– Intraday price action favors sellers,
– Broker participation favors cautious accumulation.
This divergence often appears during early pullbacks within broader uptrends.
Consolidated Outlook
JGS remains structurally intact within its long-term uptrend above the 200-day EMA, but short-term momentum has clearly softened after failing to sustain moves above ₱28.75 resistance.
The high-volume decline, coupled with a bearish Dominant Range Index, suggests that the market may retest lower technical levels, particularly the ₱25.50 support zone. If the stock fails to stabilize above its short-term EMA, further downside probing becomes likely.
However, the bullish Market Sentiment Index and net foreign buying of ₱9.6 million indicate that underlying demand has not disappeared. Instead, current weakness may represent profit-taking after an 11.75% year-to-date rally, rather than the beginning of a structural reversal.
In the near term, traders should monitor whether JGS can reclaim the ₱27.90–₱28.00 VWAP zone. A sustained move above this area would weaken the bearish intraday bias. Failure to do so may open the path toward ₱25.50 support.
Overall, short-term caution is warranted, but the long-term uptrend remains intact unless key Fibonacci support levels break decisively.
For investors seeking personalized guidance on how to position around these technical levels, you may reach out to our consultancy services via the contact form below.