GT Capital Holdings (GTCAP) Price Structure Overview
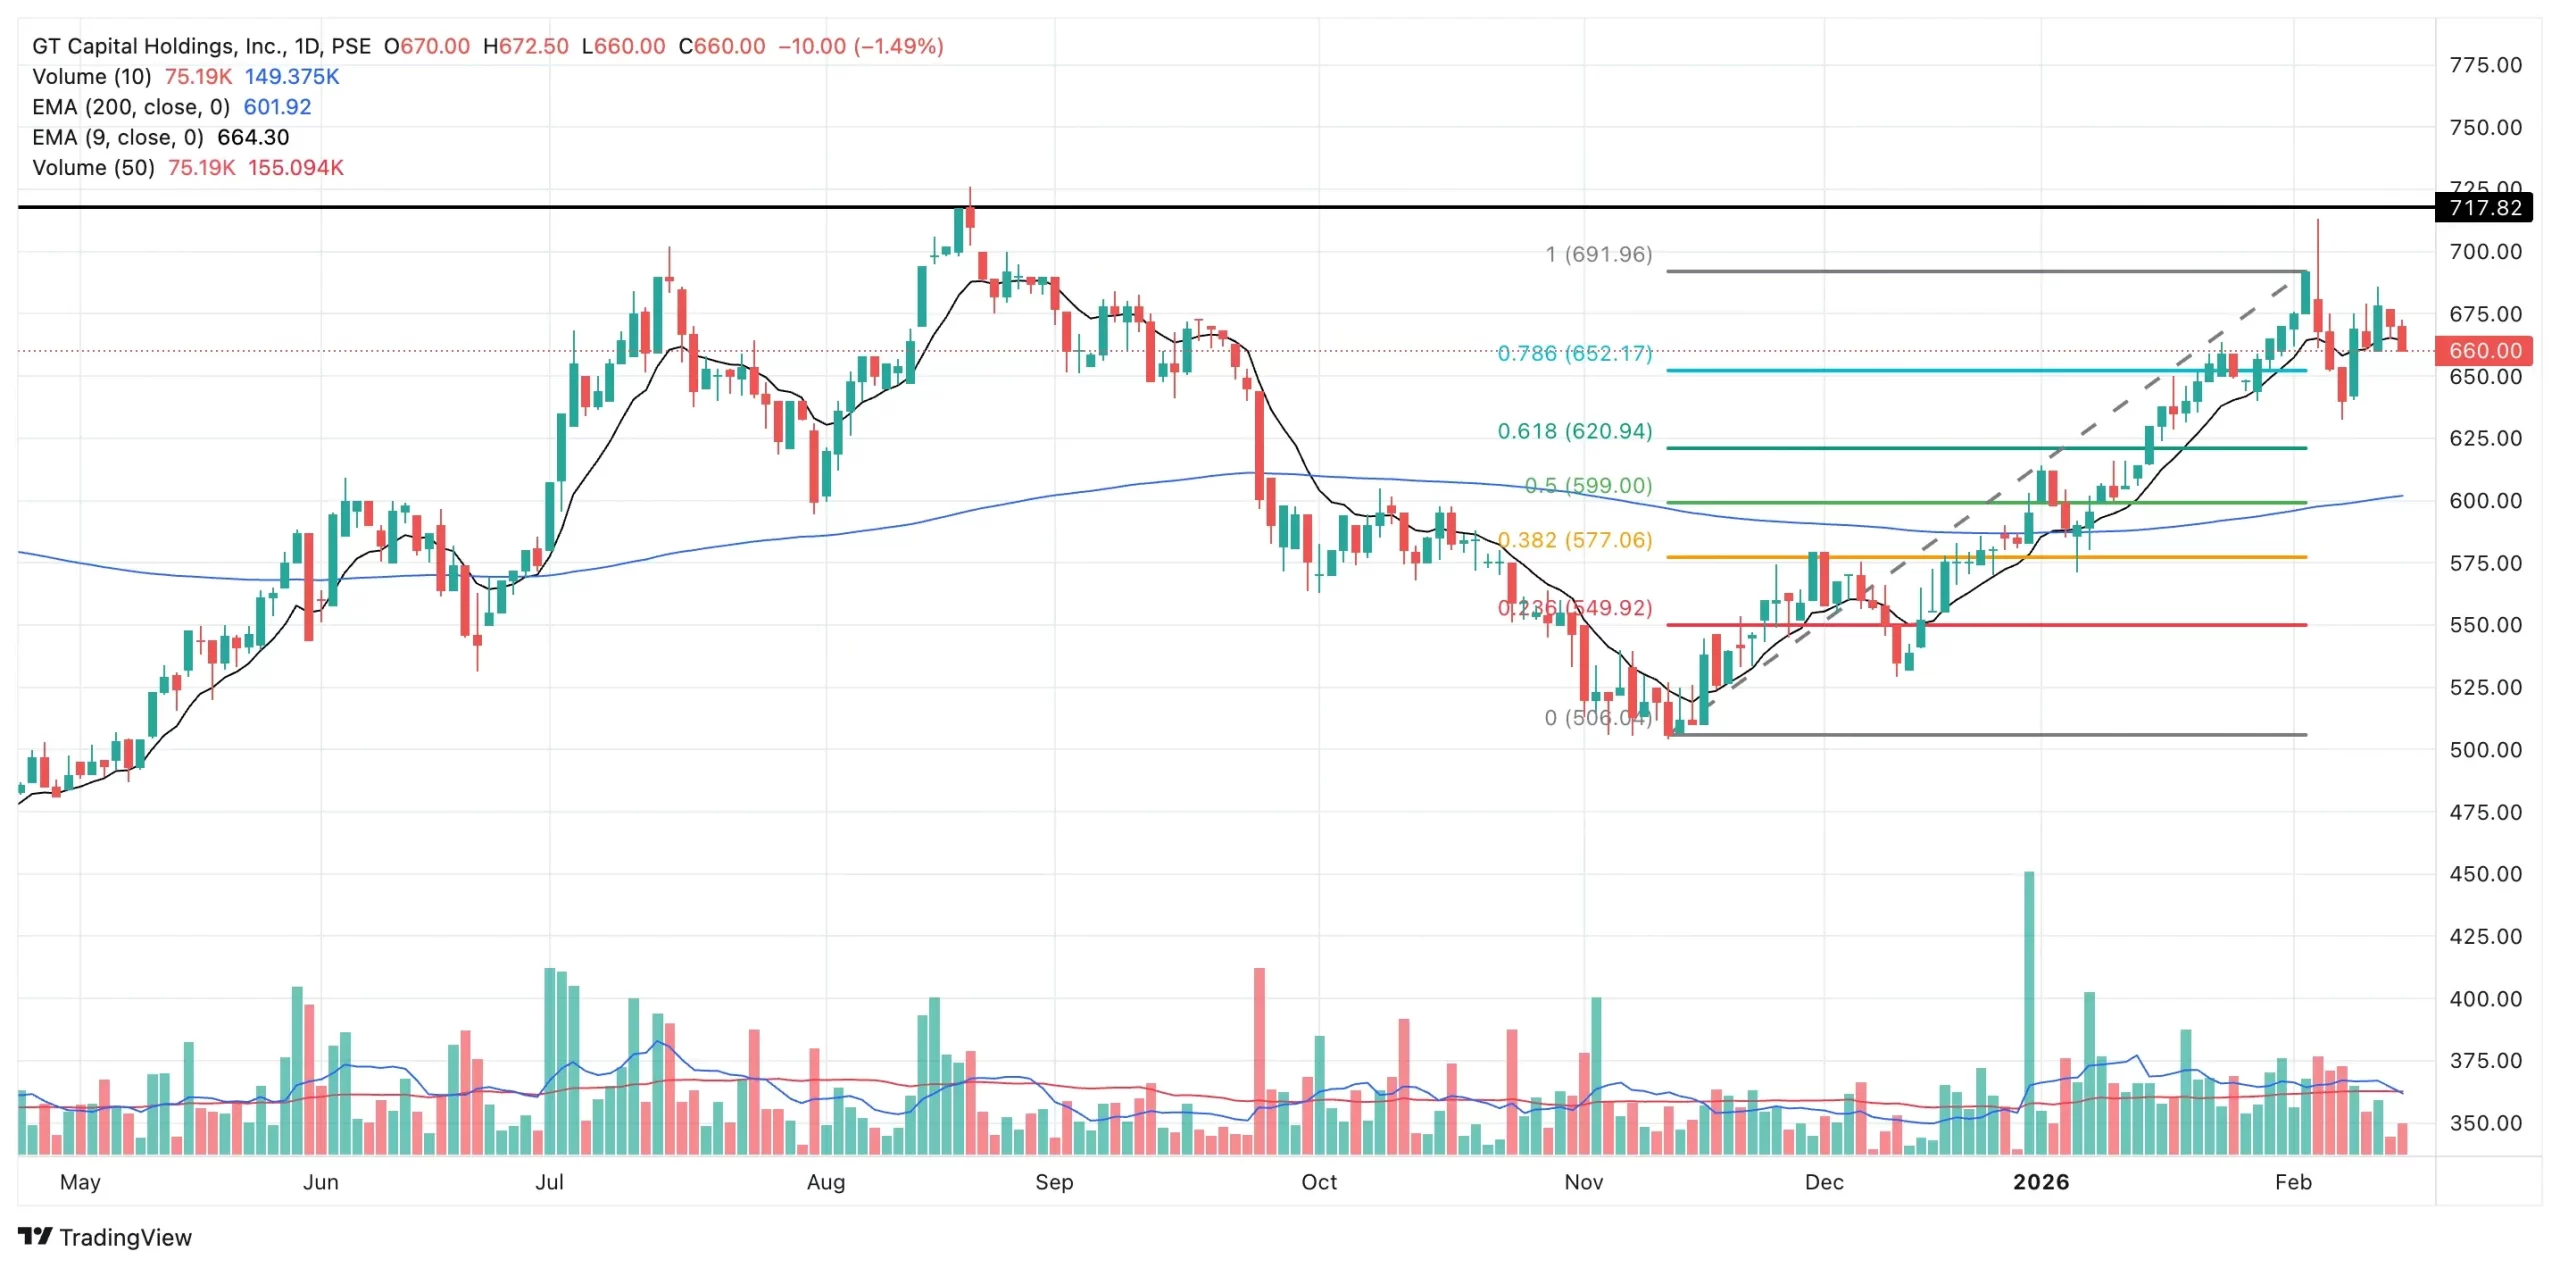
GT Capital Holdings (GTCAP) appeared to exhaust its upward momentum when it closed at ₱692.00 on February 3, 2026. That level now stands as a near-term structural ceiling. The subsequent rejection from that zone triggered a steady pullback, eventually leading to a breakdown below its 9-day EMA, signaling that short-term momentum has decisively weakened.
As of February 13, 2026, GTCAP closed at ₱660.00, down 1.49% for the session. While the short-term structure has softened, the broader trend remains intact as the stock continues to trade comfortably above its 200-day EMA. This distinction is important: momentum has slowed, but the longer-term uptrend has not yet been invalidated.
Support and Resistance Structure
Immediate support sits at ₱620.00, aligned with the 61.8% Fibonacci retracement, a level often associated with institutional demand zones. However, a more tactical level lies at ₱652.00 (78.6% Fibonacci retracement). Holding above ₱652 reduces the probability of a deeper retracement toward ₱620.
If ₱652 fails to attract demand, the market may interpret that as confirmation that the pullback is not merely corrective but potentially rotational in nature.
On the upside, ₱692.00 now acts as primary resistance. A decisive reclaim of that level would neutralize much of the recent weakness and reopen the path toward ₱718.00, which serves as the next structural ceiling.
Volume Analysis: Passive Weakness, Not Aggressive Selling
Volume has been notably thin over the past two trading sessions, failing to reach even 50% of the 10-day average volume. This is a crucial contextual clue.
The decline is occurring without aggressive distribution. Thin volume pullbacks typically indicate:
- A lack of urgency from sellers
- A holding pattern among existing shareholders
- Reduced speculative participation
In other words, while price is drifting lower, it is not being forced down by heavy liquidation. This suggests hesitation rather than panic.
Dominant Range Index: BEARISH
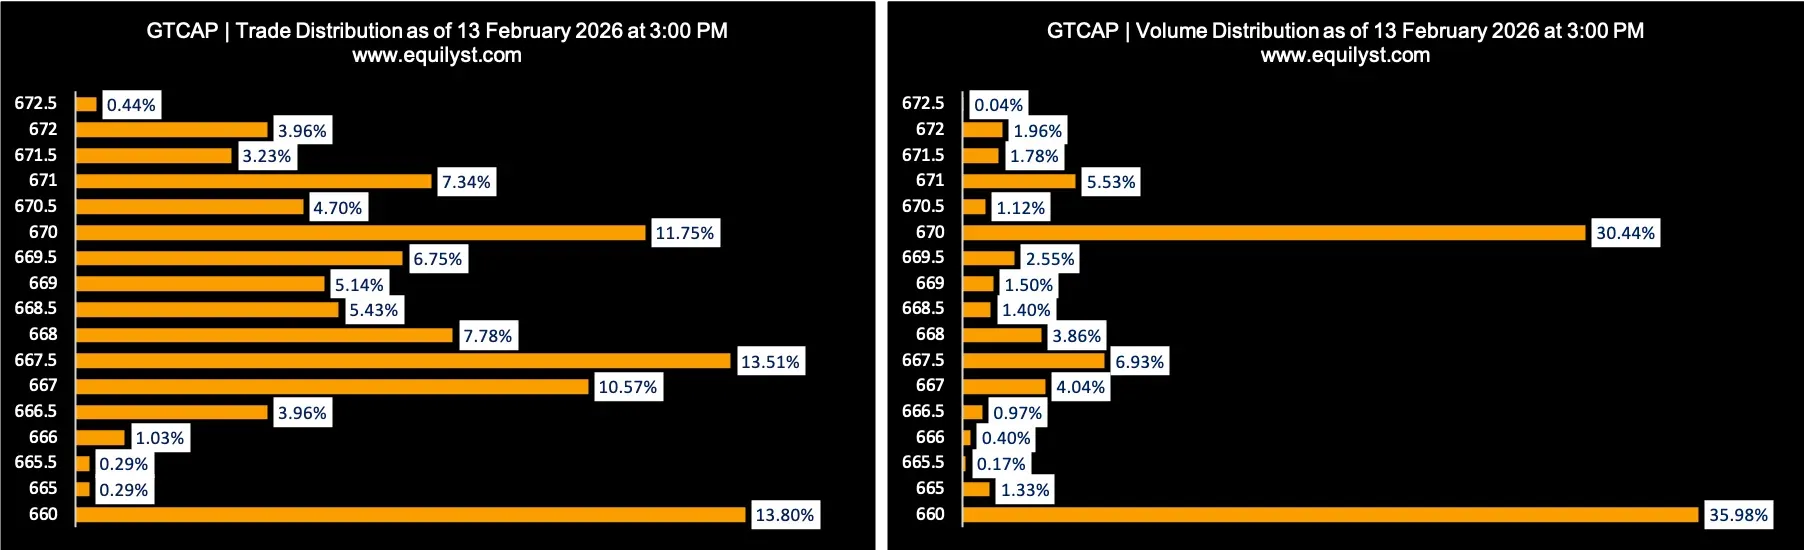
Last Price: ₱660.00
Dominant Range: ₱660.00 – ₱660.00
VWAP: ₱665.9856
The Dominant Range Index registers BEARISH because the session’s dominant price is a standalone print at the closing level of ₱660.00. This indicates that the highest concentration of executed trades gravitated toward the session’s lower boundary.
Furthermore, the VWAP at ₱665.99 sits significantly above the closing price, meaning that a substantial portion of trades earlier in the session occurred at higher levels. As trading progressed, sellers gradually pushed prices downward, shifting control intraday.
The dominance of a single closing-level price suggests:
- Late-session selling pressure
- Weak closing auction strength
- Minimal intraday recovery attempts
If price opens next week above ₱660.00, the ₱667.00–₱670.00 range becomes critical. That zone represents the second dominant cluster and may act as immediate supply if buyers attempt to stage a rebound.
Market Sentiment Index (MSI): BULLISH
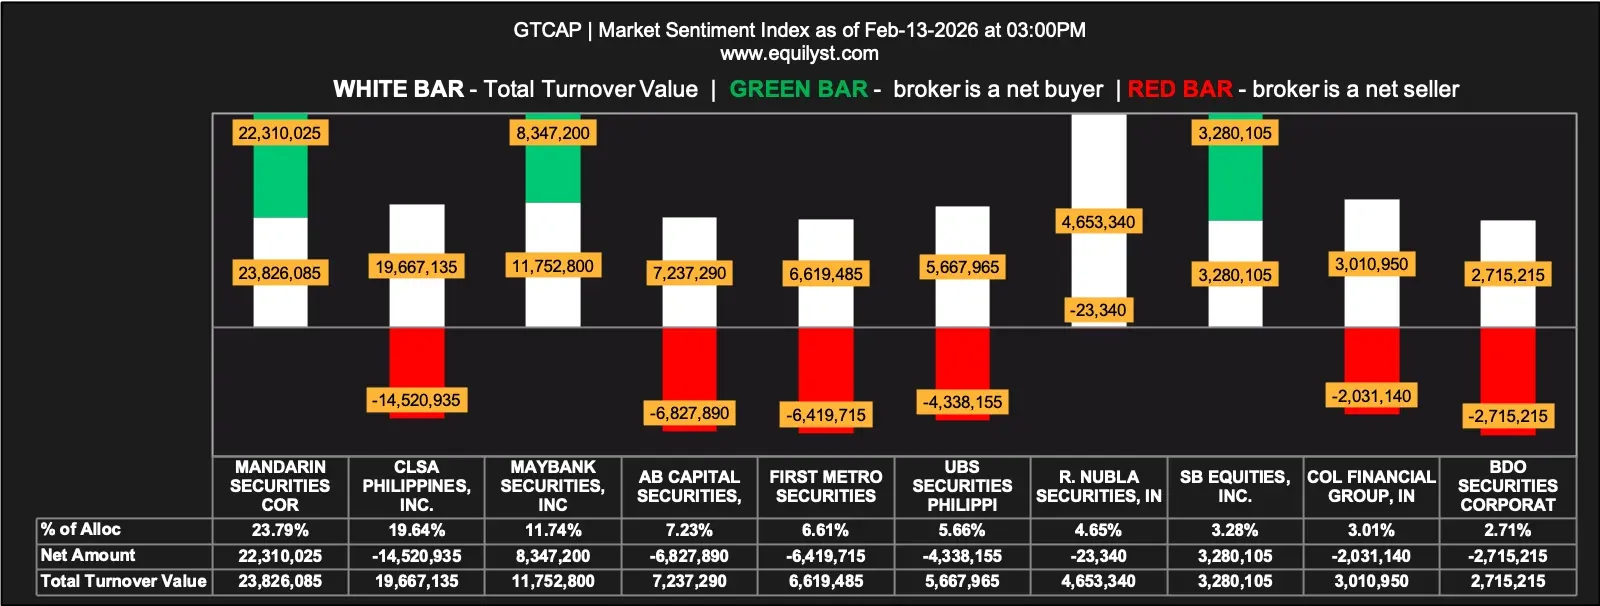
Despite the bearish intraday range structure, the Market Sentiment Index is BULLISH. This divergence between price structure and broker participation is where the analysis becomes more nuanced.
Participation Breakdown
- 15 of 28 brokers (53.57%) posted a positive Aggregate Net Amount
- 17 of 28 brokers (60.71%) had a higher Buying Average than Selling Average
- Aggregate Buying Average: ₱664.53693
- Aggregate Selling Average: ₱666.81849
- 12 brokers (42.86%) registered 100% BUYING activity
- 4 brokers (14.29%) registered 100% SELLING activity
Synthesizing the Data
At first glance, the MSI suggests broad-based accumulation:
- A majority of brokers ended net buyers
- Nearly 43% of participants were pure buyers
- Only 14% were pure sellers
This imbalance strongly favors accumulation behavior over distribution.
However, the aggregate selling average (₱666.82) is higher than the aggregate buying average (₱664.54). This nuance matters. It implies that sellers were able to transact at slightly higher price levels, while buyers accumulated closer to lower levels.
What does this mean?
It suggests a passive absorption dynamic:
- Sellers are unloading into strength early in the session
- Buyers are stepping in gradually as price weakens
- The closing price at ₱660 reflects the intraday tug-of-war, not outright dominance by sellers
In essence:
- Price action says “weak intraday control.”
- Broker participation says “underlying demand still present.”
The fact that 60.71% of brokers had higher buying averages than selling averages indicates that even brokers who sold shares likely transacted more aggressively on the buy side overall.
This pattern often appears during:
- Controlled pullbacks within broader uptrends
- Institutional accumulation during short-term weakness
- Low-volume retracements where stronger hands step in quietly
However, MSI bullishness alone is not sufficient to negate technical weakness. If price continues drifting lower while MSI remains bullish, it may indicate that accumulation is occurring at progressively lower levels, a sign of patience, not urgency.
Integrated Outlook
GTCAP currently reflects a short-term corrective phase within a broader bullish structure.
Key observations:
- Price is below its 9-day EMA → short-term momentum weakened
- Price remains above its 200-day EMA → long-term uptrend intact
- Volume is thin → lack of aggressive selling
- Dominant Range Index is bearish → sellers controlled the close
- Market Sentiment Index is bullish → broker-level accumulation persists
This combination typically describes a cooling phase rather than a breakdown.
The critical pivot is ₱652.00. Holding above this level keeps the pullback constructive. A sustained move below it increases the probability of testing ₱620.00 support.
Conversely, reclaiming the ₱667–₱670 dominant supply zone would be the first signal that buyers are regaining short-term control.
For now, GTCAP appears to be in consolidation under resistance, with broker behavior leaning cautiously constructive despite weak closing structure.
The next decisive move will likely occur once volume expands meaningfully, either validating accumulation or confirming deeper retracement.
If you want a structured, data driven breakdown of your own portfolio or watchlist using the same framework, feel free to reach out through the contact form below.