Emperador (EMI) Price Structure Overview
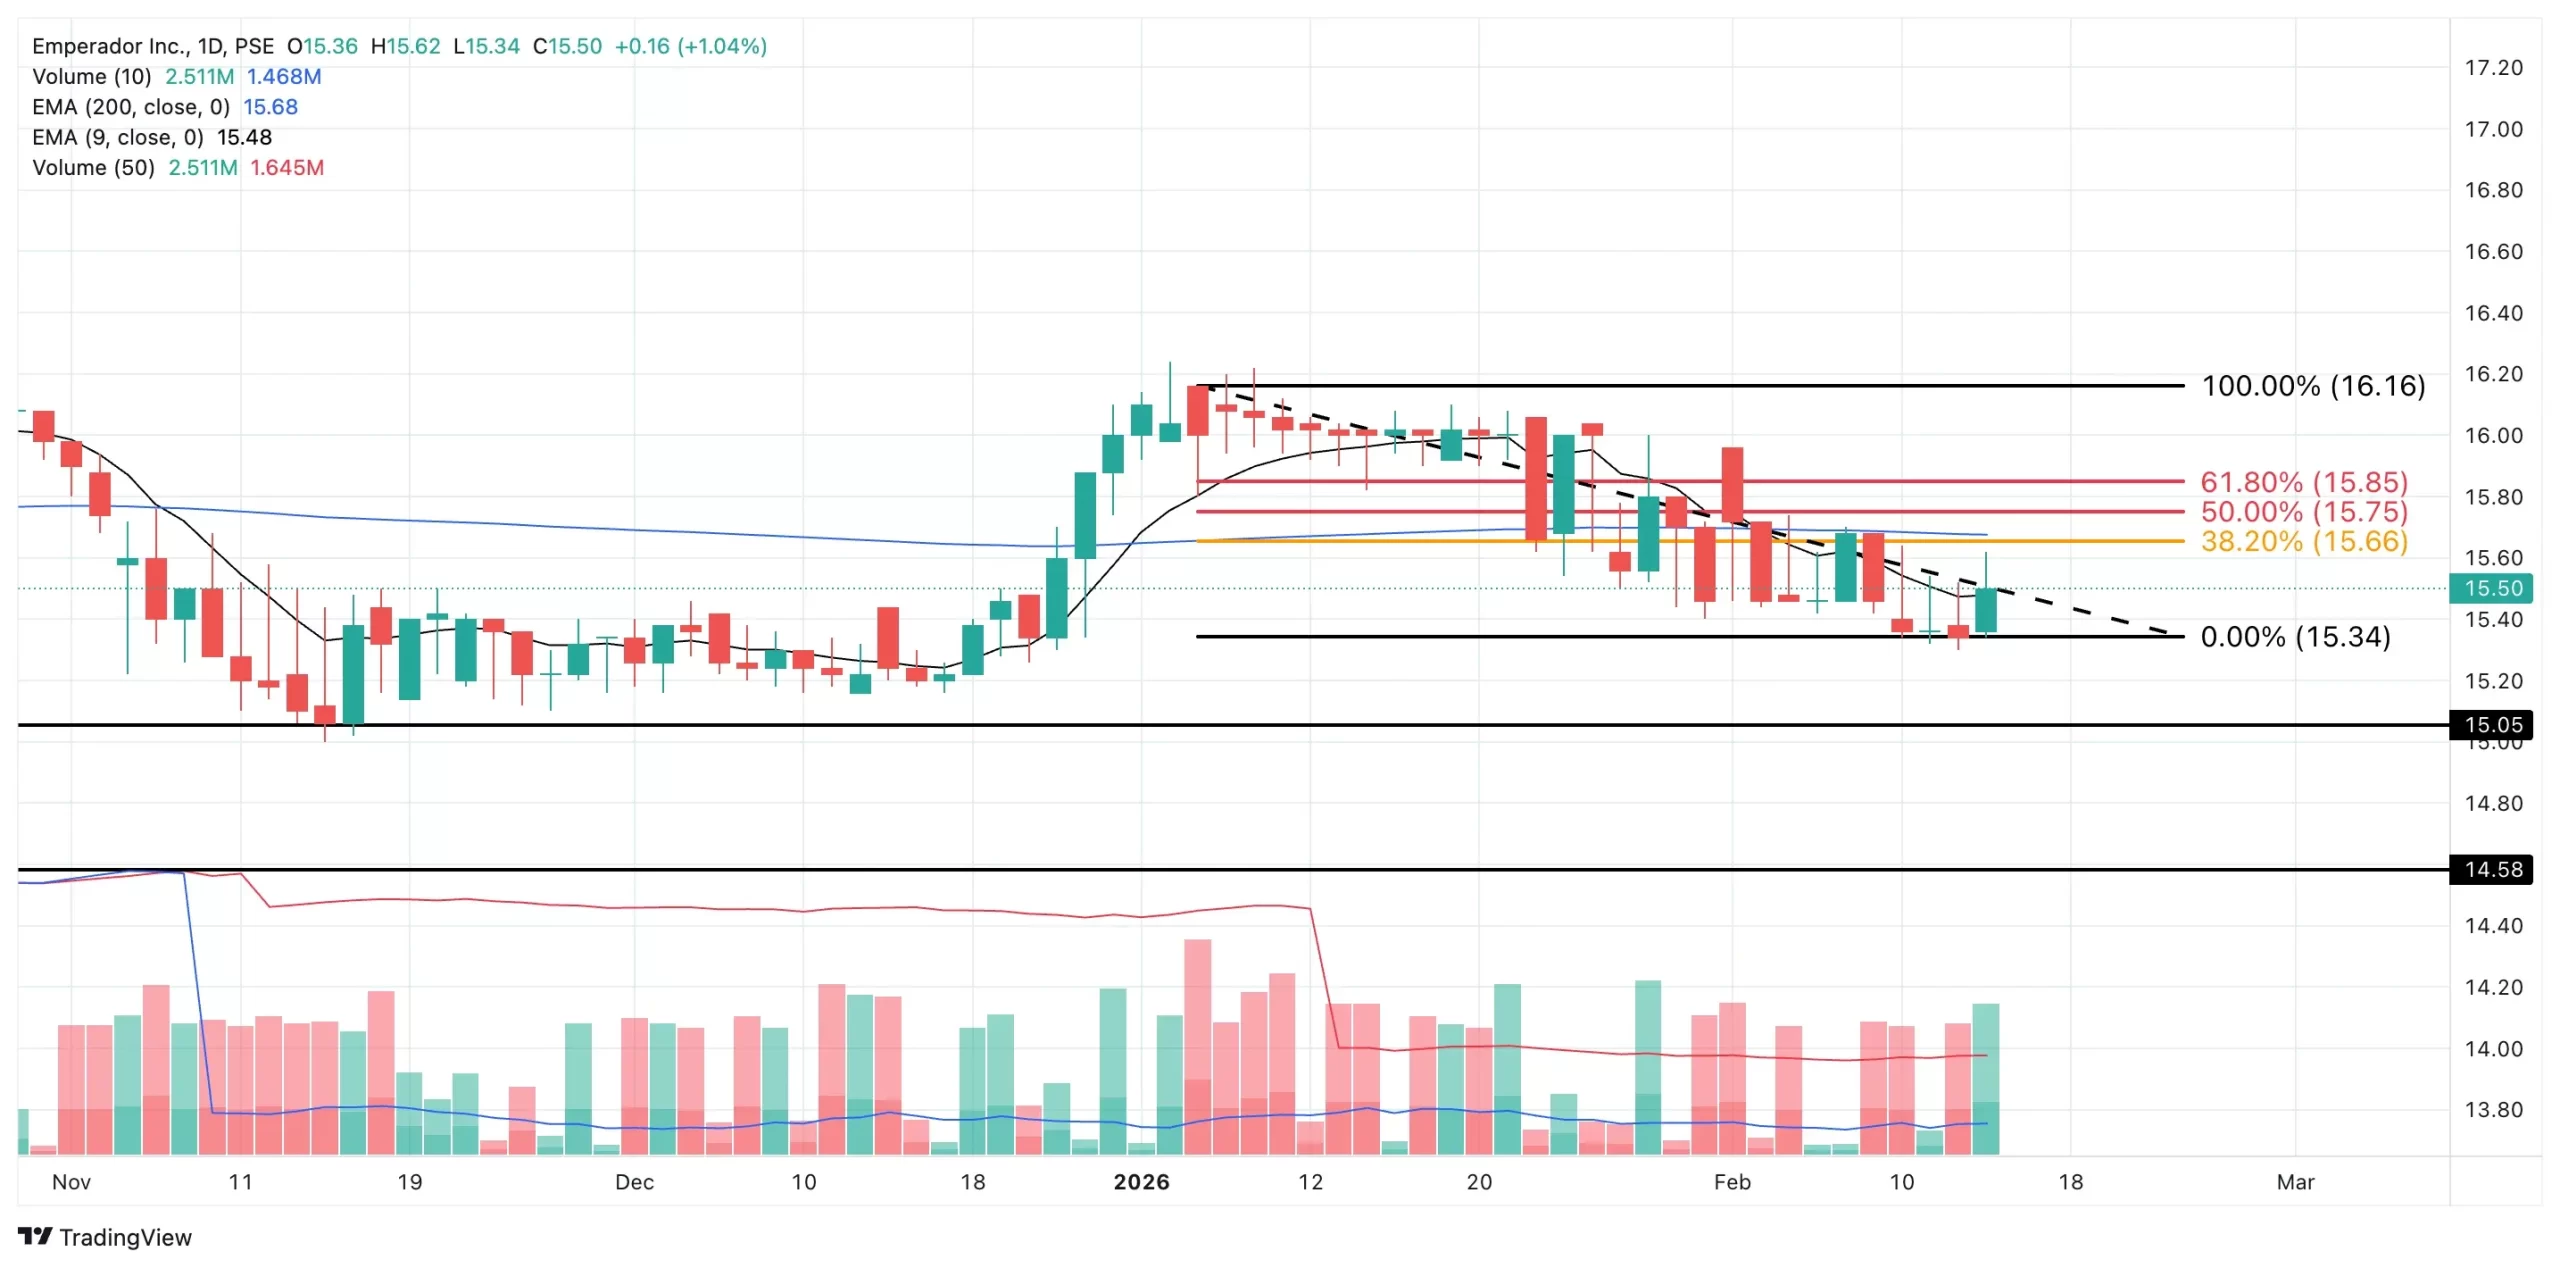
Emperador (EMI) struggled to extend the upward momentum established during the final trading week of 2025. That advance stalled at ₱16.16, which now stands as a structural ceiling in the near term. Since that rejection, EMI has entered a downtrend channel, trading below its 200-day EMA, which lies within the broader 38.2% to 50% Fibonacci retracement zone. This positioning confirms that the longer-term structure has weakened.
On February 13, 2026, EMI closed at ₱15.50, up 1.04%, despite recording a Net Foreign Selling of ₱9.3 million. The positive day change in the face of foreign selling suggests that domestic or selective institutional participation absorbed the supply intraday. However, this does not immediately reverse the broader downtrend bias.
Immediate support rests at ₱15.34, while deeper structural support lies at ₱15.05. Overhead, resistance forms a defined band between ₱15.66 (38.2% Fibonacci) and ₱15.85 (61.8% Fibonacci). If EMI continues to consolidate, this band becomes the decisive battlefield between recovery attempts and renewed selling pressure.
Volume Confirmation
Volume exceeded 100% of both the 10-day and 50-day averages, which significantly strengthens the relevance of the current price action. High volume validates participation and reduces the likelihood that the move is merely noise.
In trending environments, elevated volume often confirms continuation. However, context matters. Since EMI remains below its 200-day EMA and inside a downtrend channel, strong volume must be evaluated carefully. If buyers cannot push price through the resistance band despite this level of participation, it signals that supply remains dominant at higher levels.
Thus, the resistance zone between ₱15.66 and ₱15.85 becomes even more critical. Heavy volume without a breakout suggests distribution. Heavy volume with a breakout suggests structural reversal.
Dominant Range Index: BULLISH
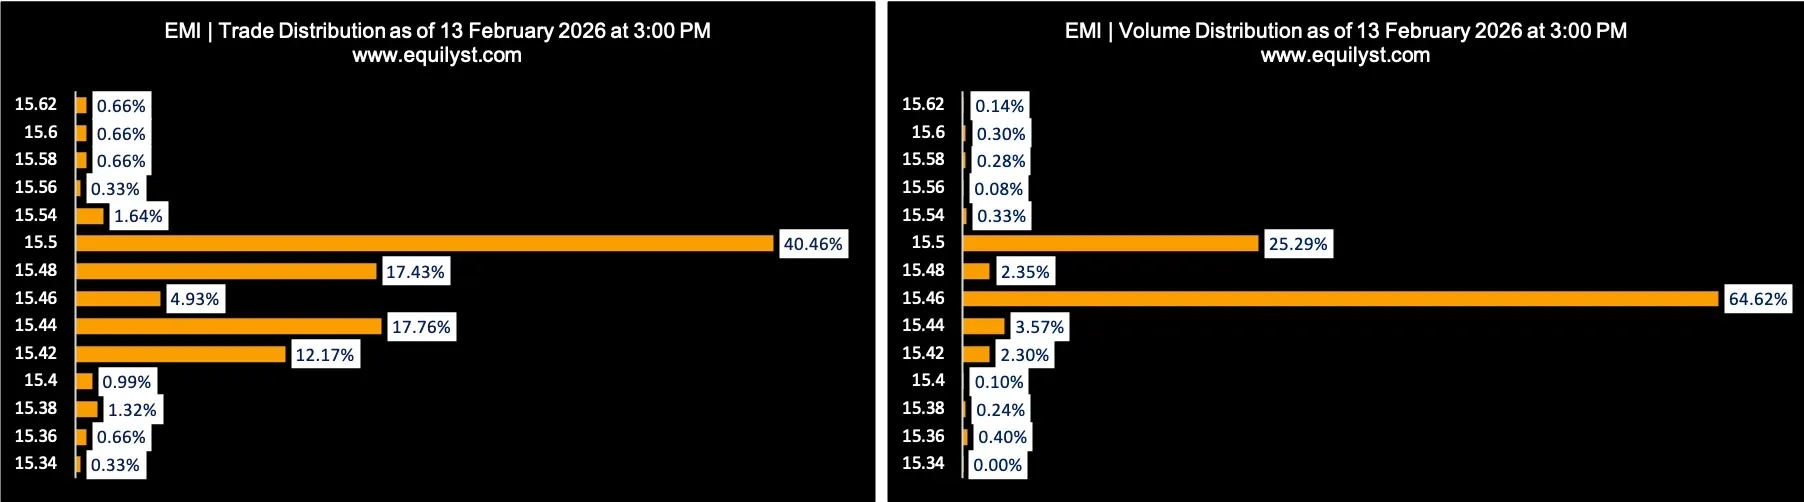
Last Price: ₱15.50
Dominant Range: ₱15.42 – ₱15.50
VWAP: ₱15.4696
The Dominant Range Index registers BULLISH, and this is not a superficial reading. The dominant range sits closer to the intraday high than the intraday low, indicating that the bulk of transactional activity occurred near the upper boundary of the session’s range.
This has several implications:
- Buyers were willing to transact closer to resistance rather than waiting for pullbacks.
- The closing price aligns with the upper boundary of the dominant range.
- VWAP at ₱15.4696 sits slightly below the closing price, suggesting that the average participant transacted at lower levels than where the stock ultimately closed.
This structure implies late-session demand or sustained intraday absorption, both of which favor short-term continuation. In isolation, the Dominant Range Index suggests that buyers controlled the tape during the session.
However, dominance within a single day does not negate the broader downtrend. It merely signals that short-term control temporarily shifted.
Market Sentiment Index: BEARISH (Contrarian Signal)
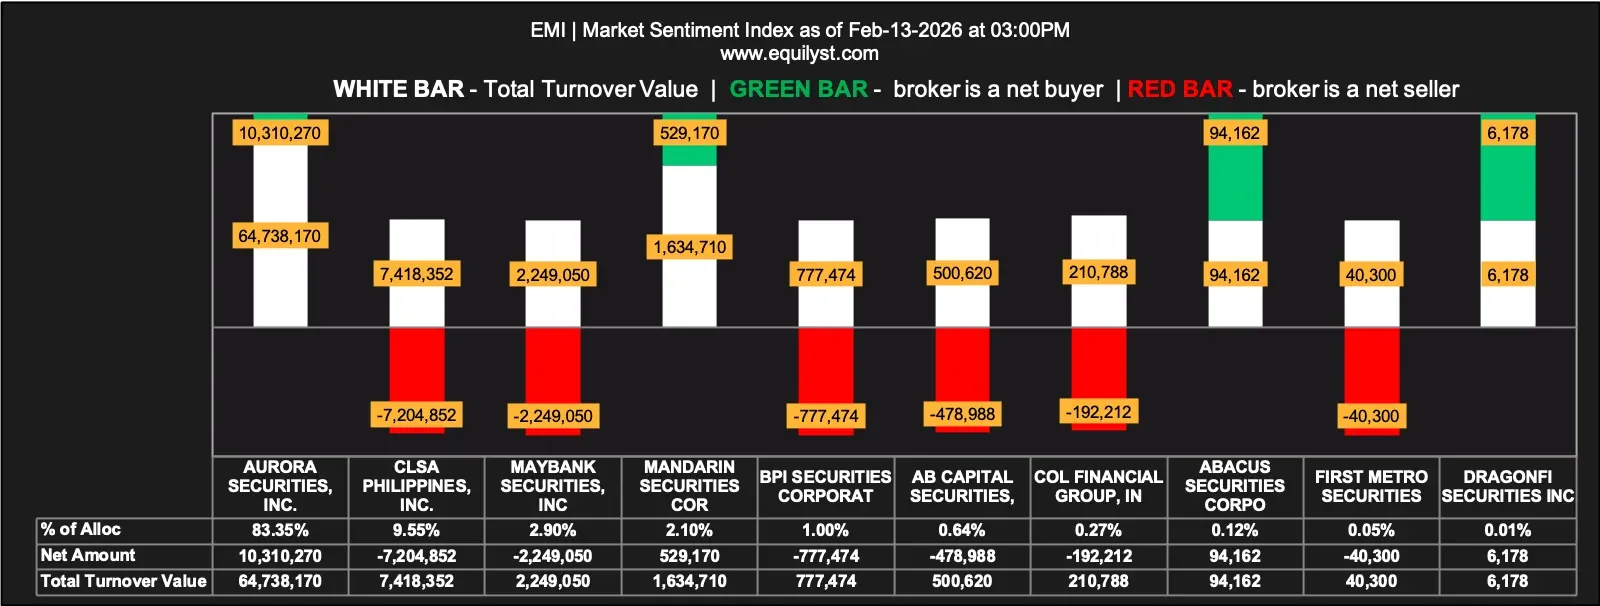
5 of 11 brokers (45.45%) posted a positive Aggregate Net Amount
4 of 11 brokers (36.36%) posted higher Buying Average than Selling Average
Aggregate Buying Average: ₱15.46395
Aggregate Selling Average: ₱15.48964
3 brokers (27.27%) were 100% BUYING
3 brokers (27.27%) were 100% SELLING
The Market Sentiment Index prints BEARISH, and this is where the analysis becomes nuanced.
Despite the stock closing higher and the Dominant Range Index favoring buyers, broker participation metrics lean negative:
- Fewer than half of brokers ended net buyers.
- Only 36.36% showed stronger buying averages than selling averages.
- Aggregate selling average exceeds aggregate buying average.
This creates a contrarian divergence.
What does this divergence mean?
It suggests that while price finished strong intraday, broker-level distribution remained present beneath the surface. Sellers were able to transact at slightly higher average prices than buyers. That subtle pricing advantage matters because it indicates that supply was still active, even if the closing print appears constructive.
The symmetry between 100% buyers and 100% sellers further reinforces indecision. Participation is fragmented rather than unified. There is no overwhelming accumulation wave.
In contrarian analysis, when price closes strong but broker sentiment is bearish, two scenarios may unfold:
- The bullish price action represents short covering rather than genuine accumulation.
- Selective large participants supported the close, but broader market conviction remains weak.
The MSI suggests caution. It signals that the upward move may lack broad institutional backing.
Consolidated Outlook
EMI presents a layered technical picture:
- The broader structure remains weak as price trades below the 200-day EMA inside a downtrend channel.
- The stock sits within the 38.2% to 50% Fibonacci retracement band.
- Immediate support at ₱15.34 and deeper support at ₱15.05 define downside risk.
- Resistance between ₱15.66 and ₱15.85 forms a decisive supply zone.
- Volume is elevated and validates current price action.
- The Dominant Range Index shows intraday bullish control.
- The Market Sentiment Index issues a bearish contrarian signal.
The synthesis of these elements suggests that EMI is attempting a short-term rebound within a broader corrective structure. The bullish Dominant Range Index shows buyers can exert pressure intraday. However, the bearish MSI indicates that this strength lacks broad broker conviction.
If EMI fails to break above ₱15.66 to ₱15.85 despite strong volume, the move likely represents temporary relief rather than structural reversal. A breakout above this band, especially if accompanied by improved broker participation metrics, would shift the bias toward a more durable recovery.
Until that confirmation occurs, EMI remains tactically tradable but structurally vulnerable.
If you want a structured, data-driven breakdown of your own portfolio or watchlist using the same framework, feel free to reach out through the contact form below.