
Bloomberry Resorts Corporation (BLOOM) Price Structure Overview
Bloomberry Resorts Corporation (BLOOM) reacted to the 38.20% Fibonacci retracement during the second trading week of February 2026, where price was rejected at that level and bounced away to the downside, triggering renewed selling pressure. That rejection confirms that sellers are actively defending the retracement zone and preventing a sustained recovery.
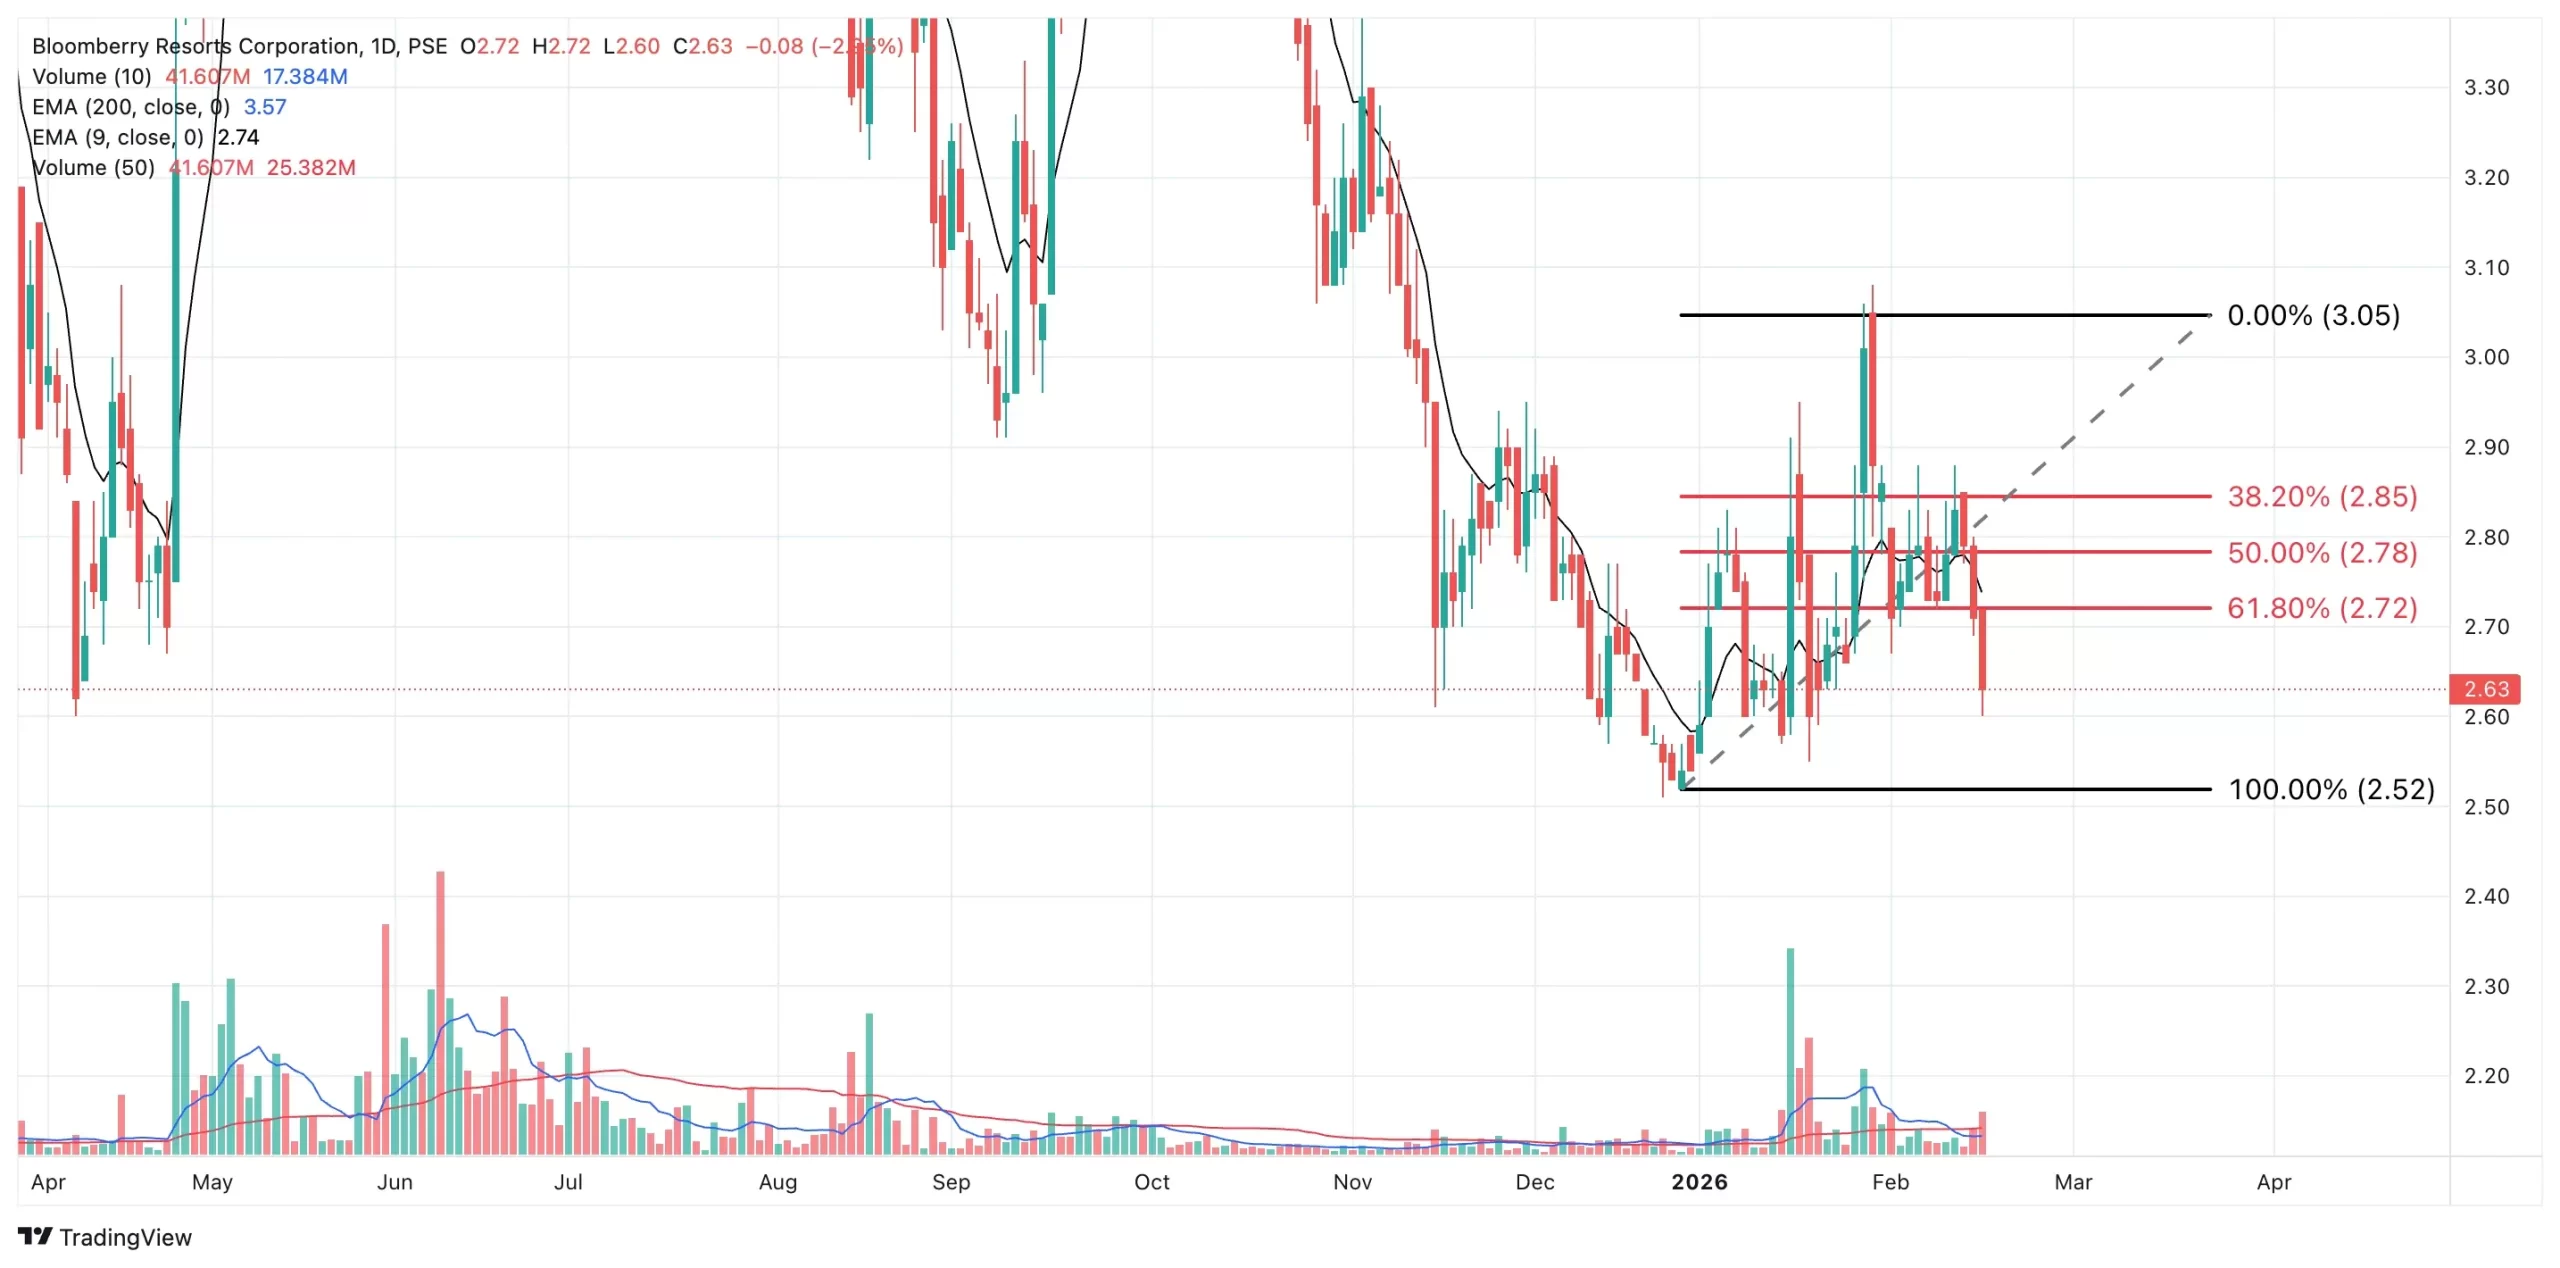
On February 16, 2026, BLOOM closed at ₱2.63 per share, down 2.95%, with a Net Foreign Selling of ₱21.10 million. The magnitude of foreign outflows reinforces the downside bias and suggests that institutional money continues to reduce exposure at current levels.
BLOOM is now trading below both its 9-day and 200-day EMAs, placing it in a confirmed short-term and long-term bearish structure. The loss of both moving averages removes dynamic support and shifts market control firmly to sellers.
Immediate support is located near ₱2.50, which now serves as the next defensive line. Overhead resistance stands at ₱2.72, confluent with the 61.80% Fibonacci retracement. This level becomes critical. Any rebound attempt must first reclaim this Fibonacci zone before sentiment can materially improve.
Volume Confirmation and Selling Pressure
Volume over the past two trading sessions exceeded 100% of both the 10-day and 50-day volume averages. This expansion in participation validates the downward move. Elevated volume during price declines signals conviction, not hesitation.
When price breaks lower on strong volume while trading beneath key moving averages, the probability of continuation increases. The market is not drifting lower on light liquidity. It is moving with force and broad participation.
Unless buyers step in with comparable strength, pressure toward the ₱2.50 support zone remains the path of least resistance.
Dominant Range Index: BEARISH
Last Price: ₱2.63
Dominant Range: ₱2.61 – ₱2.68
VWAP: ₱2.6398
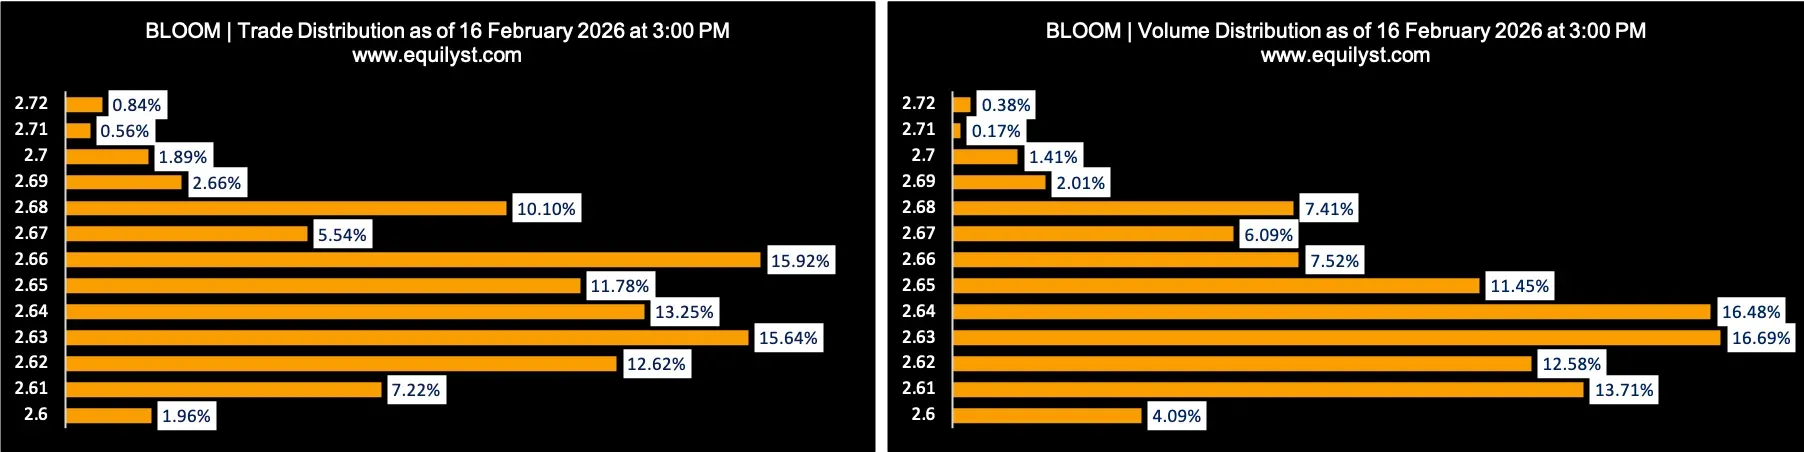
The Dominant Range Index prints BEARISH, and the internal structure of the range reinforces this reading. The dominant range sits closer to the intraday low than the intraday high, indicating that most transactions occurred nearer to the lower boundary of the session.
Although the VWAP at ₱2.6398 is slightly above the closing price, the proximity of the dominant range to the intraday low suggests that sellers maintained control throughout much of the session. Buyers did not meaningfully shift the equilibrium higher.
This alignment signals sustained intraday pressure rather than a late-session recovery. It reflects supply absorption attempts that ultimately failed to lift price meaningfully.
In context, the Dominant Range Index confirms that bearish momentum remains active and organized.
Market Sentiment Index: BULLISH Divergence
41 of 59 brokers (69.49%) posted a positive Aggregate Net Amount
43 of 59 brokers (72.88%) posted a higher Buying Average than Selling Average
Aggregate Buying Average: ₱2.64335
Aggregate Selling Average: ₱2.64599
28 brokers (47.46%) registered 100% BUYING activity
4 brokers (6.78%) registered 100% SELLING activity
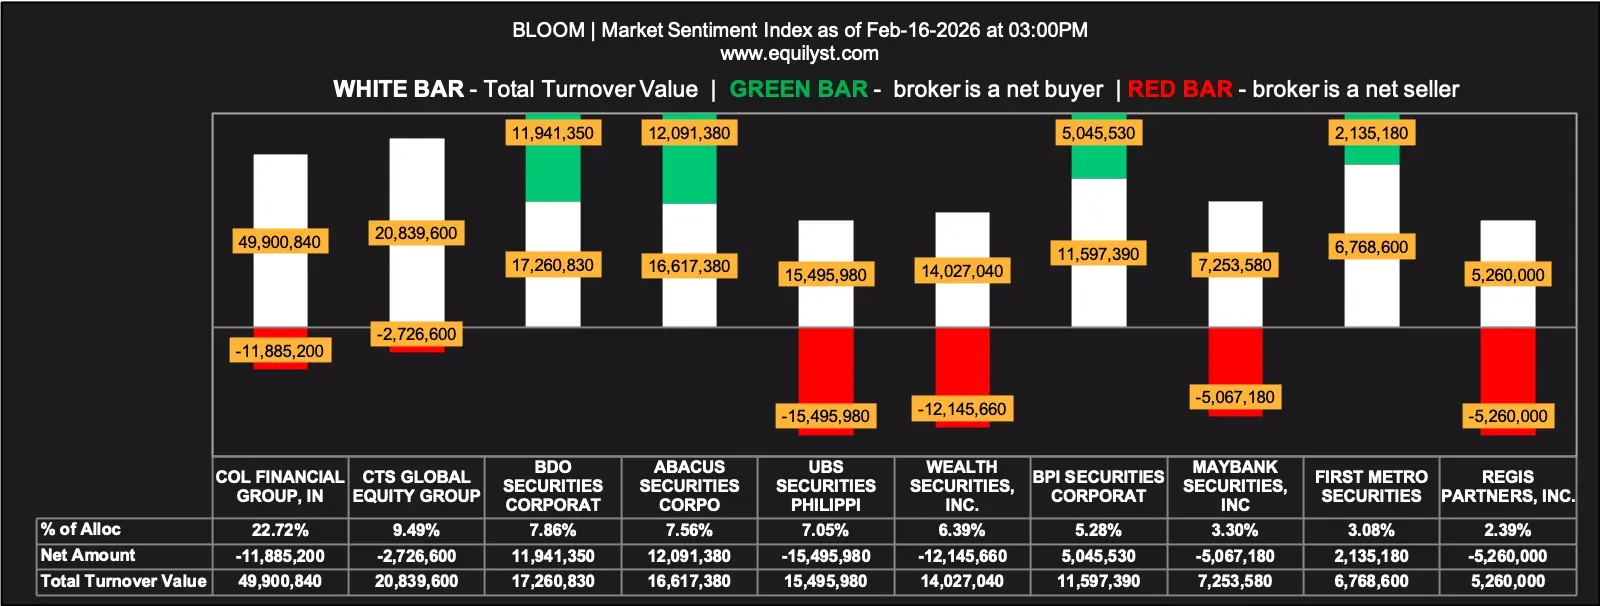
Despite the heavy selling pressure reflected in price action and volume, the Market Sentiment Index registers BULLISH, creating a notable divergence.
More than two-thirds of participating brokers ended net buyers. Nearly half recorded pure buying activity. This is not a marginal tilt. It is broad participation on the buy side.
However, the aggregate selling average remains slightly higher than the aggregate buying average. That subtle pricing advantage suggests that sellers were still able to transact at marginally better levels.
This configuration often reflects early-stage accumulation during weakness. Price declines on heavy volume, yet broker participation leans bullish. That contrast implies that while price is under pressure, selective participants may be positioning ahead of a potential technical rebound.
The Market Sentiment Index does not invalidate the downtrend. It suggests that the current selloff may be encountering demand beneath the surface.
Consolidated Outlook
BLOOM presents a structurally bearish setup with emerging contrarian undertones.
- Price trades below both the 9-day and 200-day EMAs.
- The rejection at the 38.20% Fibonacci retracement confirms active overhead supply.
- Support rests at ₱2.50.
- Resistance aligns at ₱2.72 with the 61.80% Fibonacci retracement.
- Two consecutive sessions of volume exceeding both short-term and medium-term averages validate the decline.
- The Dominant Range Index confirms intraday selling control.
- The Market Sentiment Index shows broad broker accumulation despite price weakness.
The synthesis of these signals suggests that BLOOM remains in a confirmed downtrend, but internal participation metrics reveal that buyers are selectively absorbing supply.
If ₱2.50 fails, the technical structure weakens further. If price stabilizes near support and broker accumulation persists, a rebound attempt toward ₱2.72 becomes plausible.
For now, the dominant trend remains bearish. The Market Sentiment Index divergence introduces the possibility of tactical upside, but confirmation must come through reclaiming resistance with sustained volume and price strength.
If you want a structured, data-driven breakdown of your own portfolio or watchlist using the same framework, feel free to reach out through the contact form below.