
Price Action and Structural Context
ACEN Corporation (ACEN) met sustained selling pressure around the ₱3.00 area in January 2026, which triggered a pullback toward the ₱2.50 region. The stock closed the week on February 6, 2026 at ₱2.80, marking an 8.11% month-to-date gain.
A golden cross between the 9-day EMA and 200-day EMA formed near the ₱2.74 level, which aligns with the 38.2% Fibonacci retracement and now serves as immediate support. Price continues to hover near this zone. Immediate resistance is located at ₱2.87, aligned with the 23.6% Fibonacci retracement.
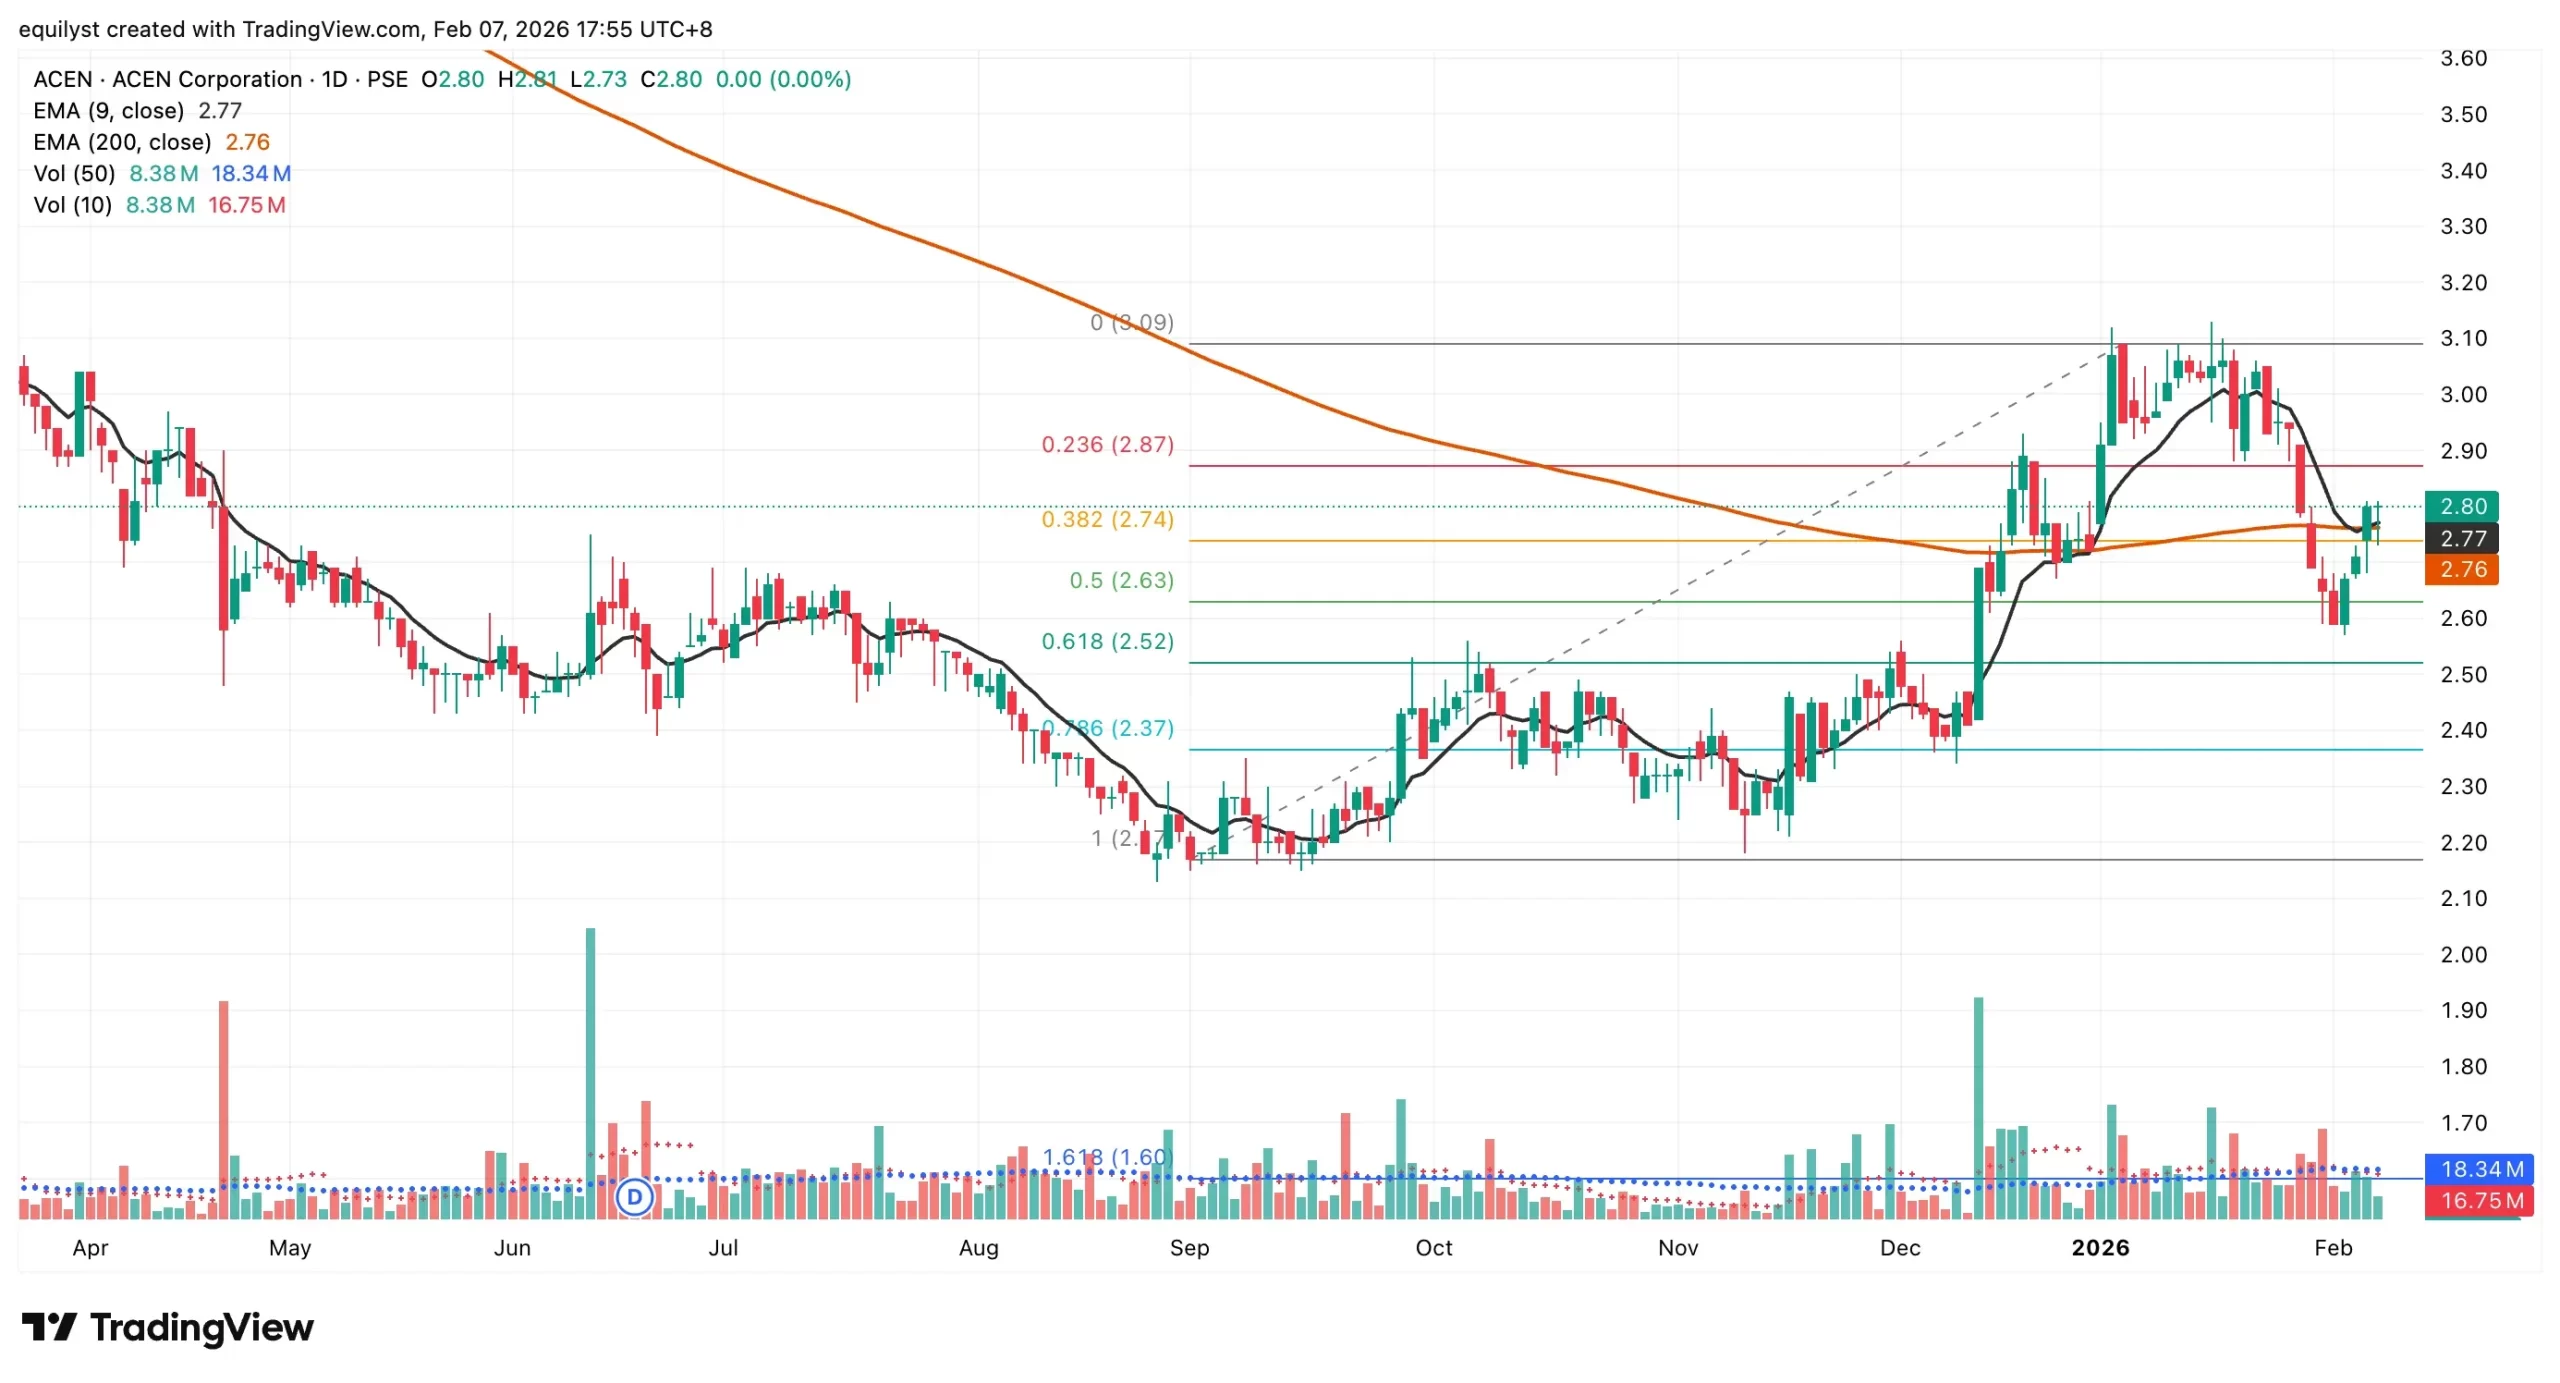
From a short-term perspective, holding above ₱2.74 keeps the recovery structure intact. A failure to defend this level would shift focus toward ₱2.63, the 50% Fibonacci retracement, as the next downside area to monitor.
From a long-term perspective, price remaining above the 200-day EMA preserves the broader trend structure. A sustained break below this moving average would weaken the longer-term technical bias and raise the probability of deeper mean reversion.
On the upside, a decisive move above ₱2.87 would expose the next resistance near ₱3.09. At present, ACEN trades above both its short-term (9-day EMA) and long-term (200-day EMA) moving averages.
Volume Conditions and Participation
Trading activity on February 6 barely reached 50% of ACEN’s 10-day volume average and remained well below 50% of its 50-day volume average. This lack of participation limited follow-through and constrained price progress, despite the broader technical setup. Thin volume likely explains why price failed to extend meaningfully beyond both its prior close and the intraday range.
From a short-term trading standpoint, muted volume increases the risk of false breakouts and near-term whipsaws. From a long-term investment standpoint, improving volume participation remains necessary to validate trend continuation rather than short-covering or tactical repositioning.
Dominant Range Index Assessment
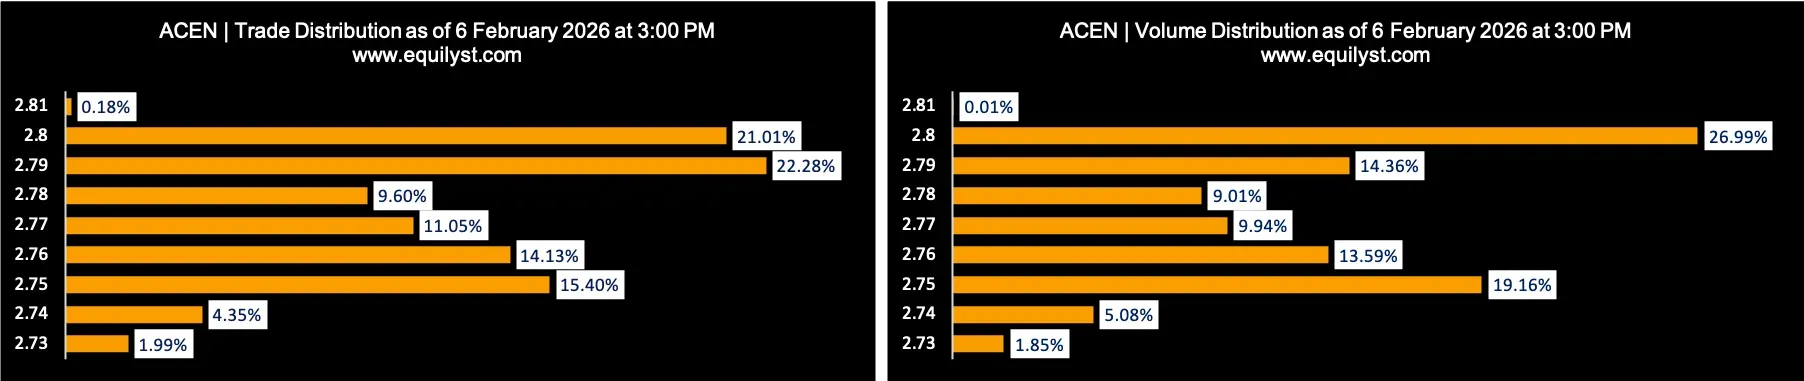
ACEN registered a bullish Dominant Range Index, yet the signal lacked reinforcement from volume. The dominant range sat near the middle of the day’s range rather than clustering closer to the intraday high. This placement reflects a balanced distribution of trades, consistent with a short-term stalemate between buyers and sellers.
Dominant Range Index: BULLISH
Last Price: ₱2.80
Dominant Range: ₱2.75 – ₱2.80
VWAP: ₱2.7744
From a short-term lens, the centered dominant range suggests intraday indecision rather than directional conviction. From a long-term lens, such balance is not inherently bearish but highlights the absence of accumulation signals at current levels.
Market Sentiment Index Perspective
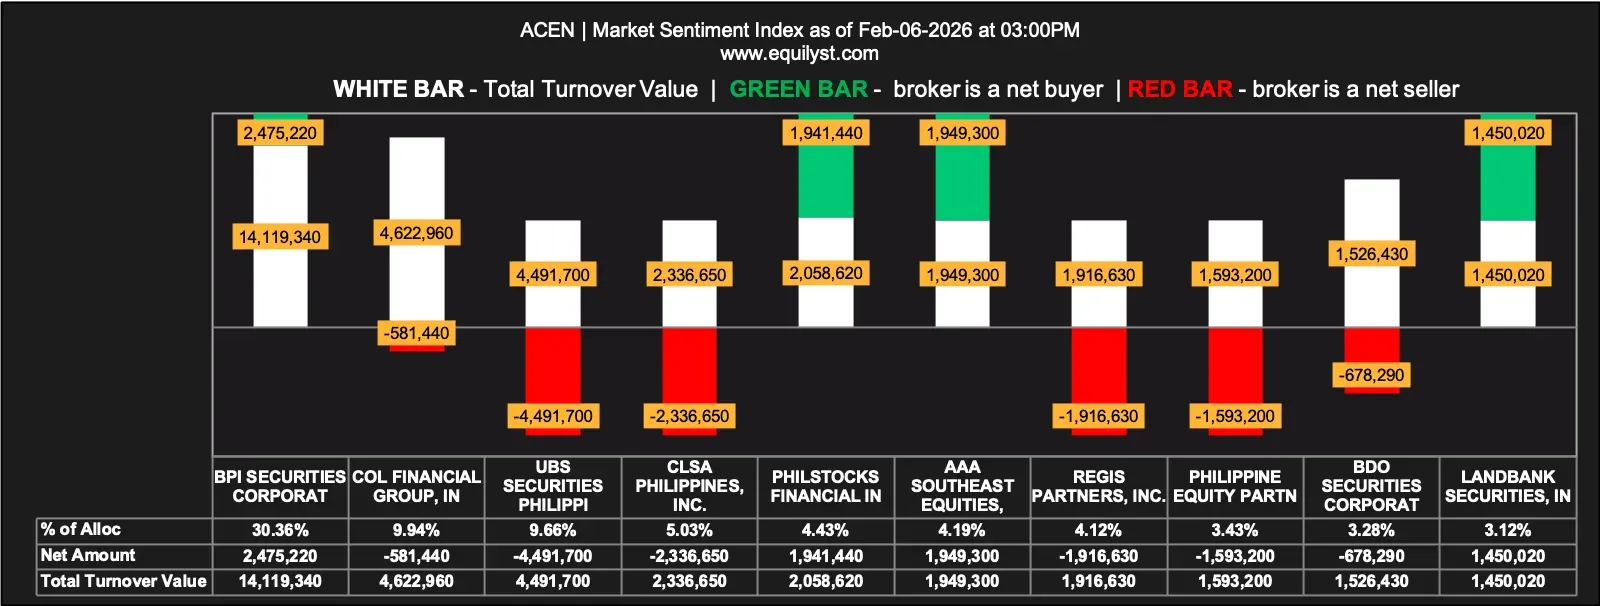
The bearish Market Sentiment Index reinforces the caution raised by volume and range behavior. While 60% of participating brokers posted a positive aggregate net amount, only 40% recorded a higher per-broker buying average than selling average. This imbalance, combined with a higher aggregate selling average than buying average, points to restrained conviction behind the recent advance rather than coordinated accumulation.
Market Sentiment Index: BEARISH
24 of the 40 participating brokers, or 60.00%, posted a positive Aggregate Net Amount
16 of the 40 participating brokers, or 40.00%, posted a higher Per-Broker Buying Average than Per-Broker Selling Average
Aggregate Buying Average: ₱2.77081
Aggregate Selling Average: ₱2.78449
12 of 40 participants, or 30.00%, registered 100% Per-Broker BUYING activity
10 of 40 participants, or 25.00%, registered 100% Per-Broker SELLING activity
From a short-term standpoint, sentiment data reflects selective participation rather than broad-based buying pressure. From a long-term standpoint, the lack of dominance from strong buyers suggests accumulation remains incomplete.
Consolidated Short-Term and Long-Term Outlook
In the short term, ACEN is positioned at a technically constructive but fragile zone. Support at ₱2.74 is critical; sustained weakness below this level could invite a retest of ₱2.63, especially if volume remains subdued.
In the long term, the stock’s position above the 200-day EMA keeps the broader structure intact. However, meaningful trend continuation will likely require expanding volume and stronger broker-level buying confirmation. Until participation improves, upside attempts may face resistance and consolidation risks.
Additional context or structured review support may be requested through the consultancy form below.