

DMCI Holdings (DMC) Daily Price Overview
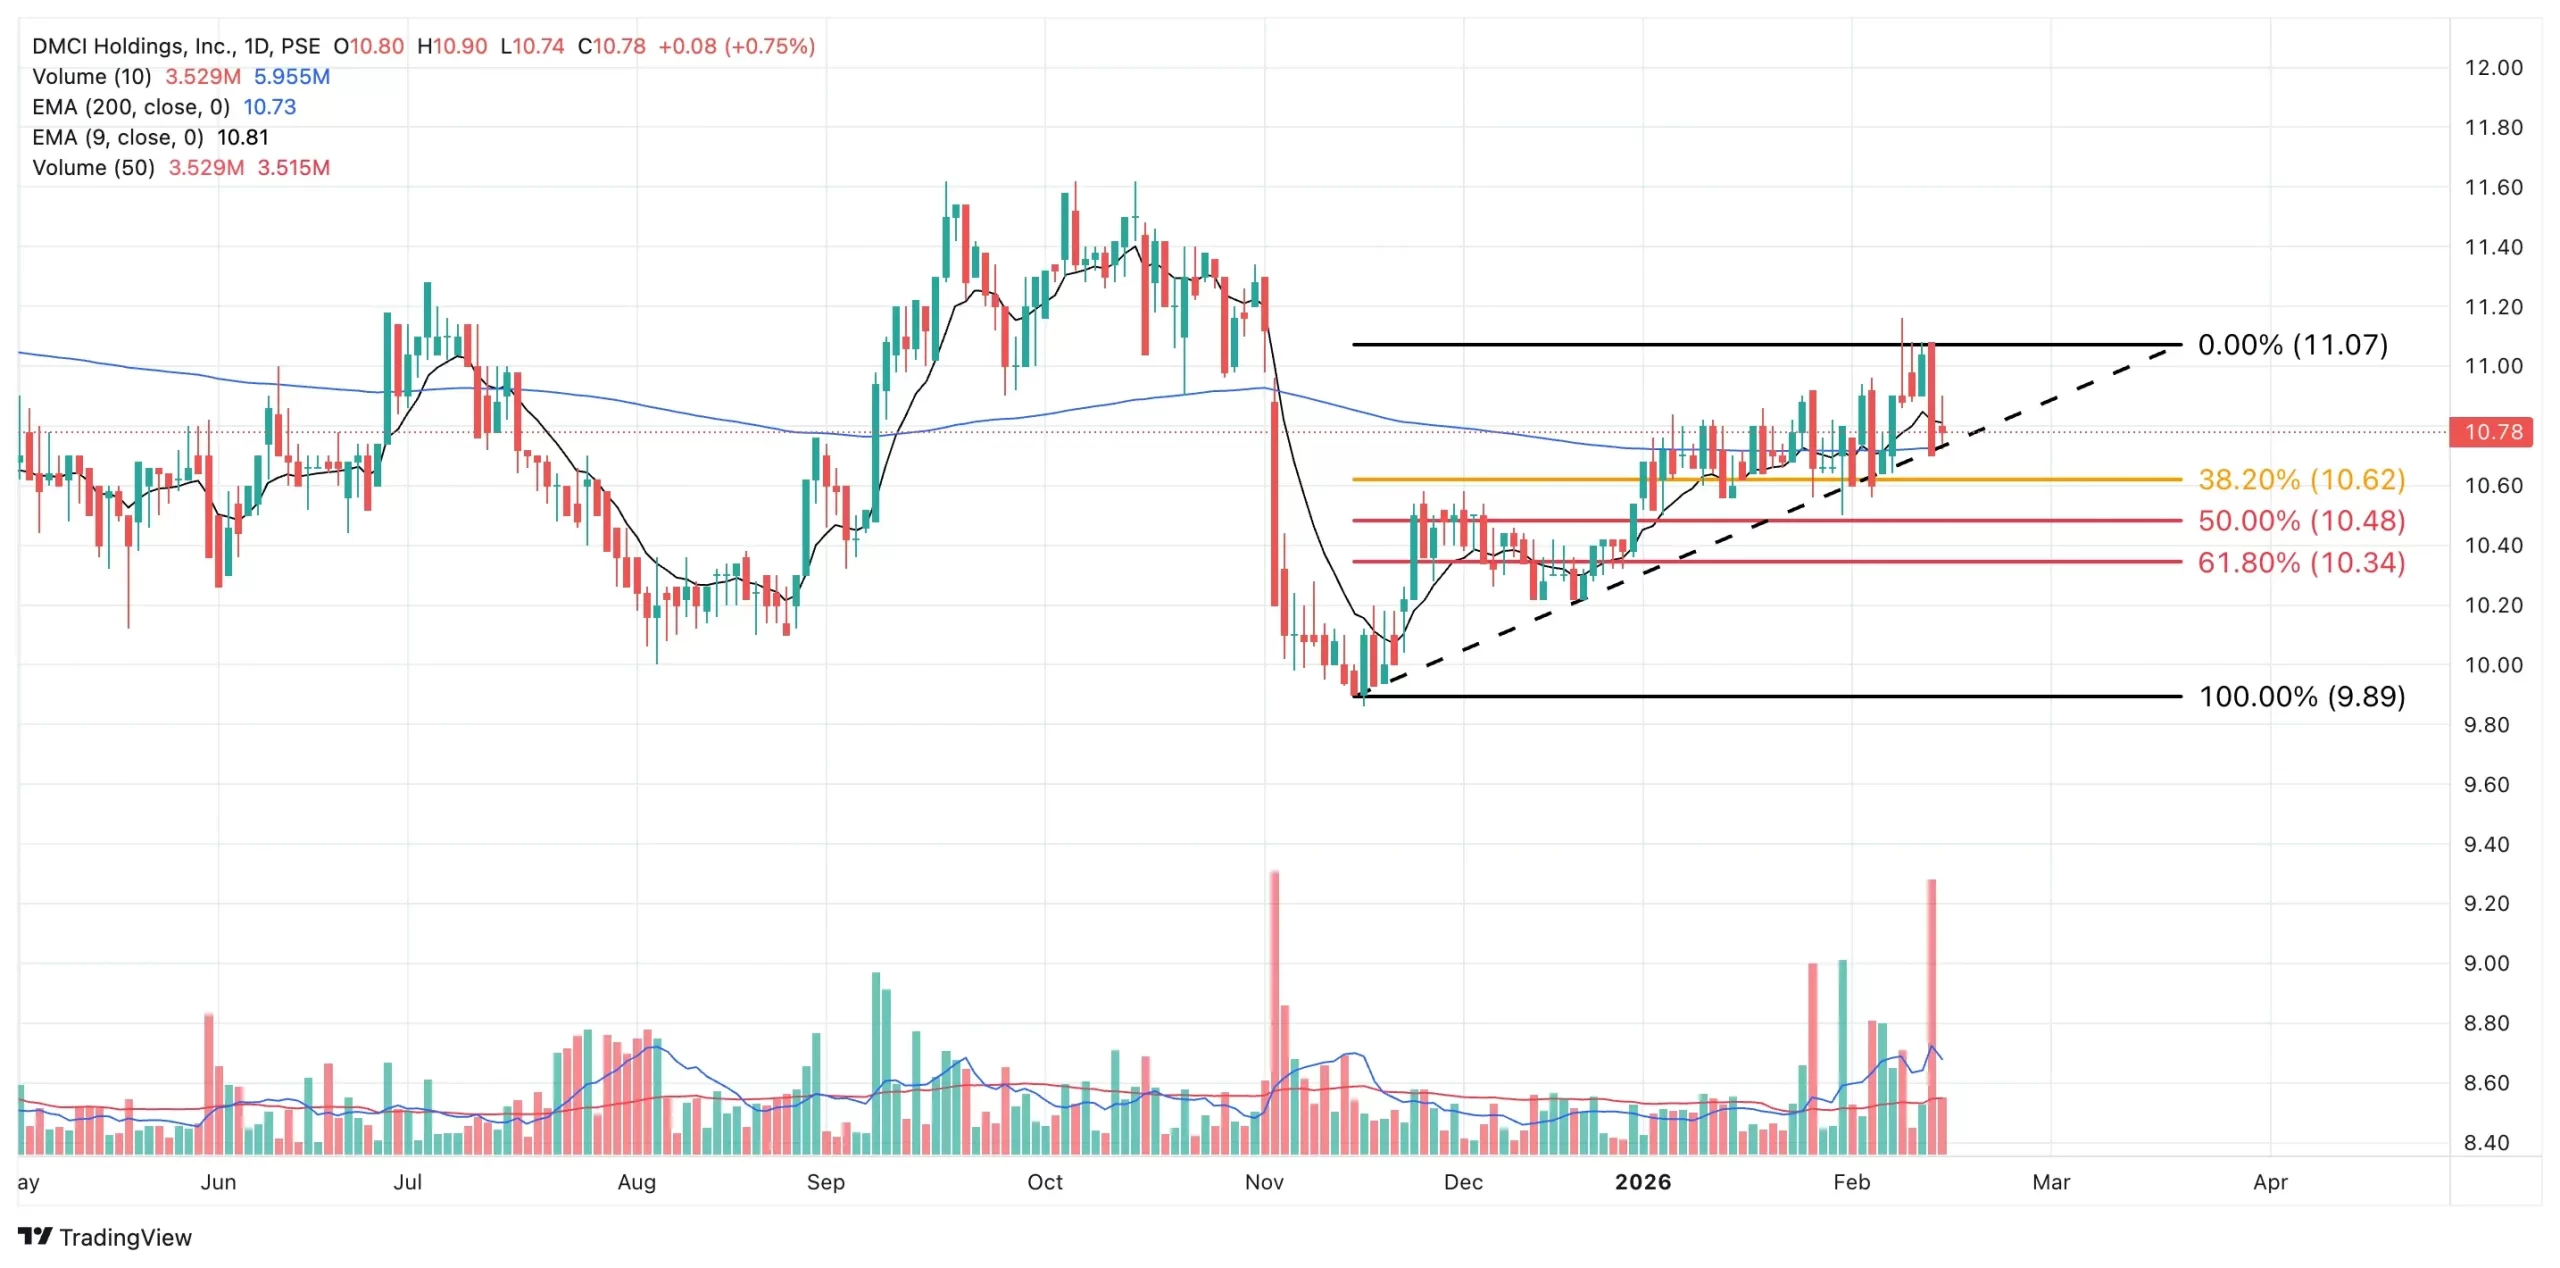
DMC closed on February 13, 2026 at ₱10.78 per share, up 0.75%, with a Net Foreign Selling of ₱1.03 million. As seen from the Fibonacci retracement, DMC bounces each time it reaches the 38.2% or 50% levels, making ₱10.62 its immediate support. The immediate resistance sits at ₱11.07. This pattern suggests the stock respects key retracement zones, which traders can use to time entry or exit points.
Technical Indicators
DMC is trading below its 9-day EMA, signaling short-term weakness, but remains slightly above its 200-day EMA, indicating that the long-term bullish trend is still intact. A break below the 200-day EMA at ₱10.72 would increase the likelihood of revisiting the 38.2%-50% Fibonacci range before challenging the deeper support at ₱10.34 (61.8% retracement). Investors should monitor these levels closely, as they act as key decision points for buying or selling.
Volume Analysis
The negative price movement today occurred on a volume that exceeded 100% of the 50-day average, but only 59% of the 10-day average, showing that while there is some conviction behind the move, it is not fully backed by recent trading momentum. Should volume reach or exceed the 10-day average, the downtrend could accelerate toward the support zone.
Dominant Range Index
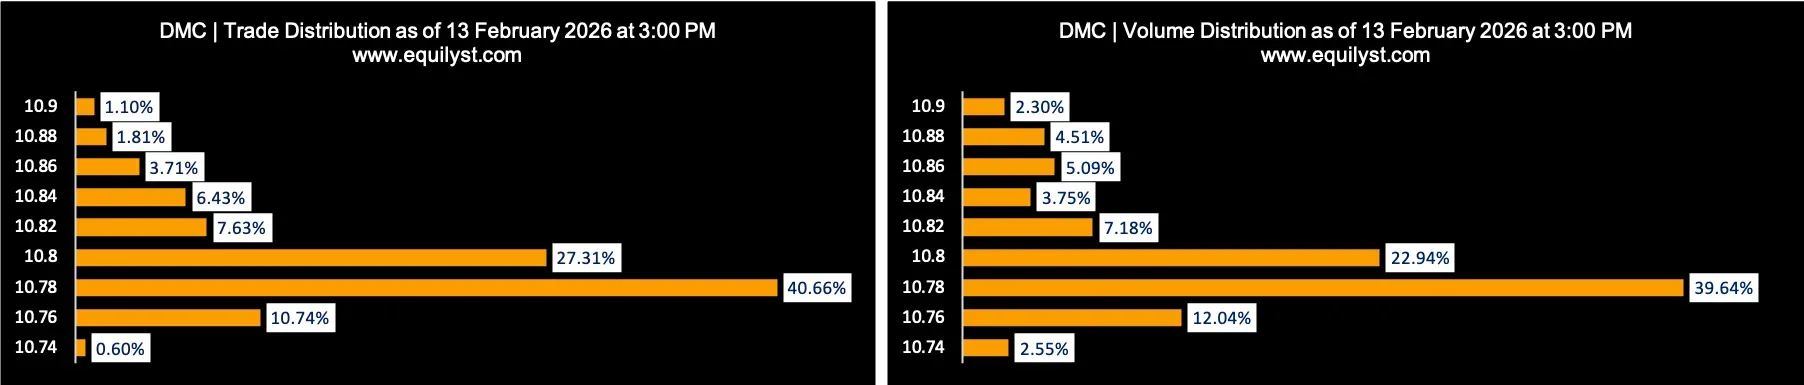
Dominant Range Index: BEARISH
Last Price: ₱10.78
Dominant Range: ₱10.78 – ₱10.78
VWAP: ₱10.7976
The dominant range of ₱10.76 to ₱10.80 is closer to the intraday low than the intraday high, highlighting short-term selling pressure. The price gravitates toward the lower end of the trading range, suggesting that unless the market sees strong buying activity, DMC is likely to test lower support levels in the near term.
Market Sentiment Index
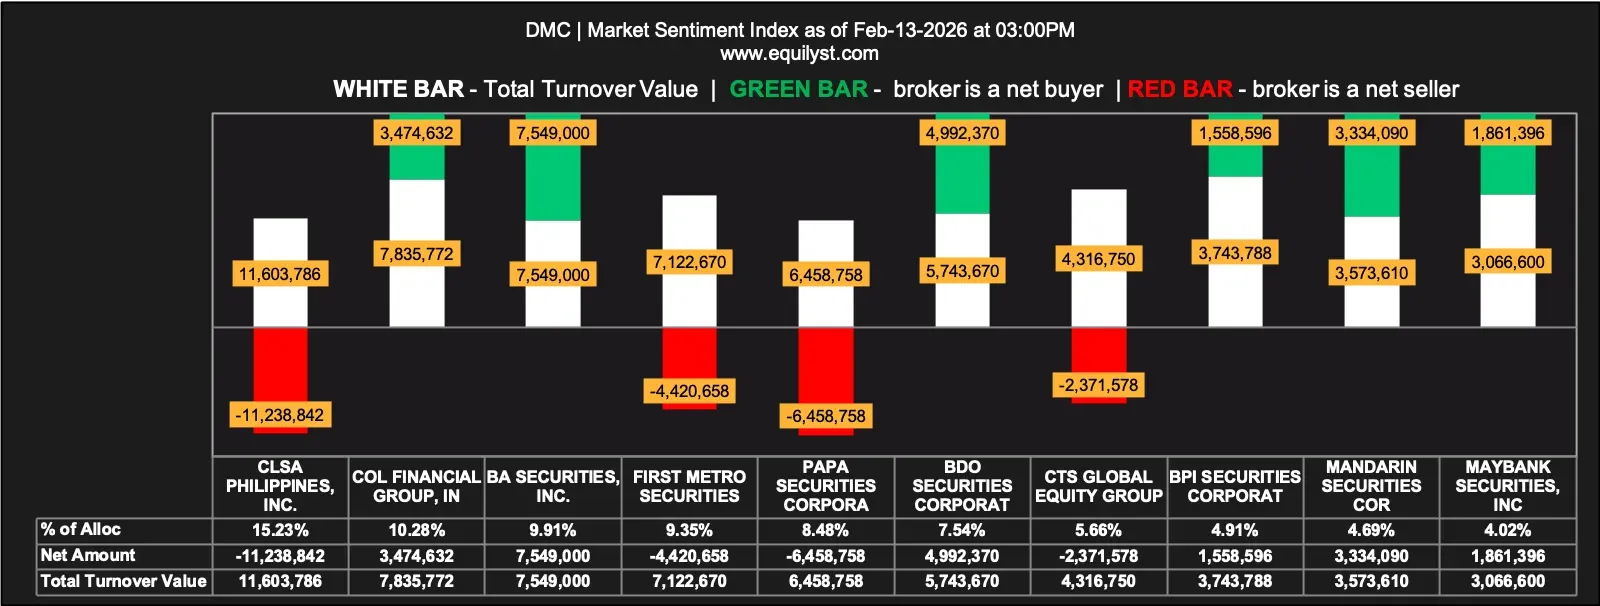
Market Sentiment Index: BULLISH
23 of 38 participating brokers (60.53%) posted a positive Aggregate Net Amount
23 of 38 participating brokers (60.53%) posted a higher Per-Broker Buying Average than Selling Average
Aggregate Buying Average: ₱10.79895
Aggregate Selling Average: ₱10.80374
14 of 38 participants (36.84%) registered 100% BUYING activity
10 of 38 participants (26.32%) registered 100% SELLING activity
Despite short-term selling pressure, the MSI shows a bullish tilt, indicating that more than half of the brokers view the current levels as a buying opportunity. The closeness of the aggregate buying and selling averages suggests cautious accumulation. Investors may be targeting the 38.2% Fibonacci retracement at ₱10.62 as a rebound zone, which explains the observed buying interest despite the downtrend.
Consolidated Outlook
DMC is under short-term pressure while long-term support remains intact. The bearish Dominant Range Index points to a near-term pullback toward ₱10.62, but the bullish Market Sentiment Index signals underlying accumulation interest. Investors might be considering the 38.2% Fibonacci level as a rebound zone, which is why we see some buying today despite the downtrend. Holding above the 200-day EMA at ₱10.72 could limit the downside. A decisive break below this EMA may prompt a retest of deeper support at ₱10.34.
You can reach out to us for a tailored consultation or to discuss your trading strategy.