Price Action and Trend Context
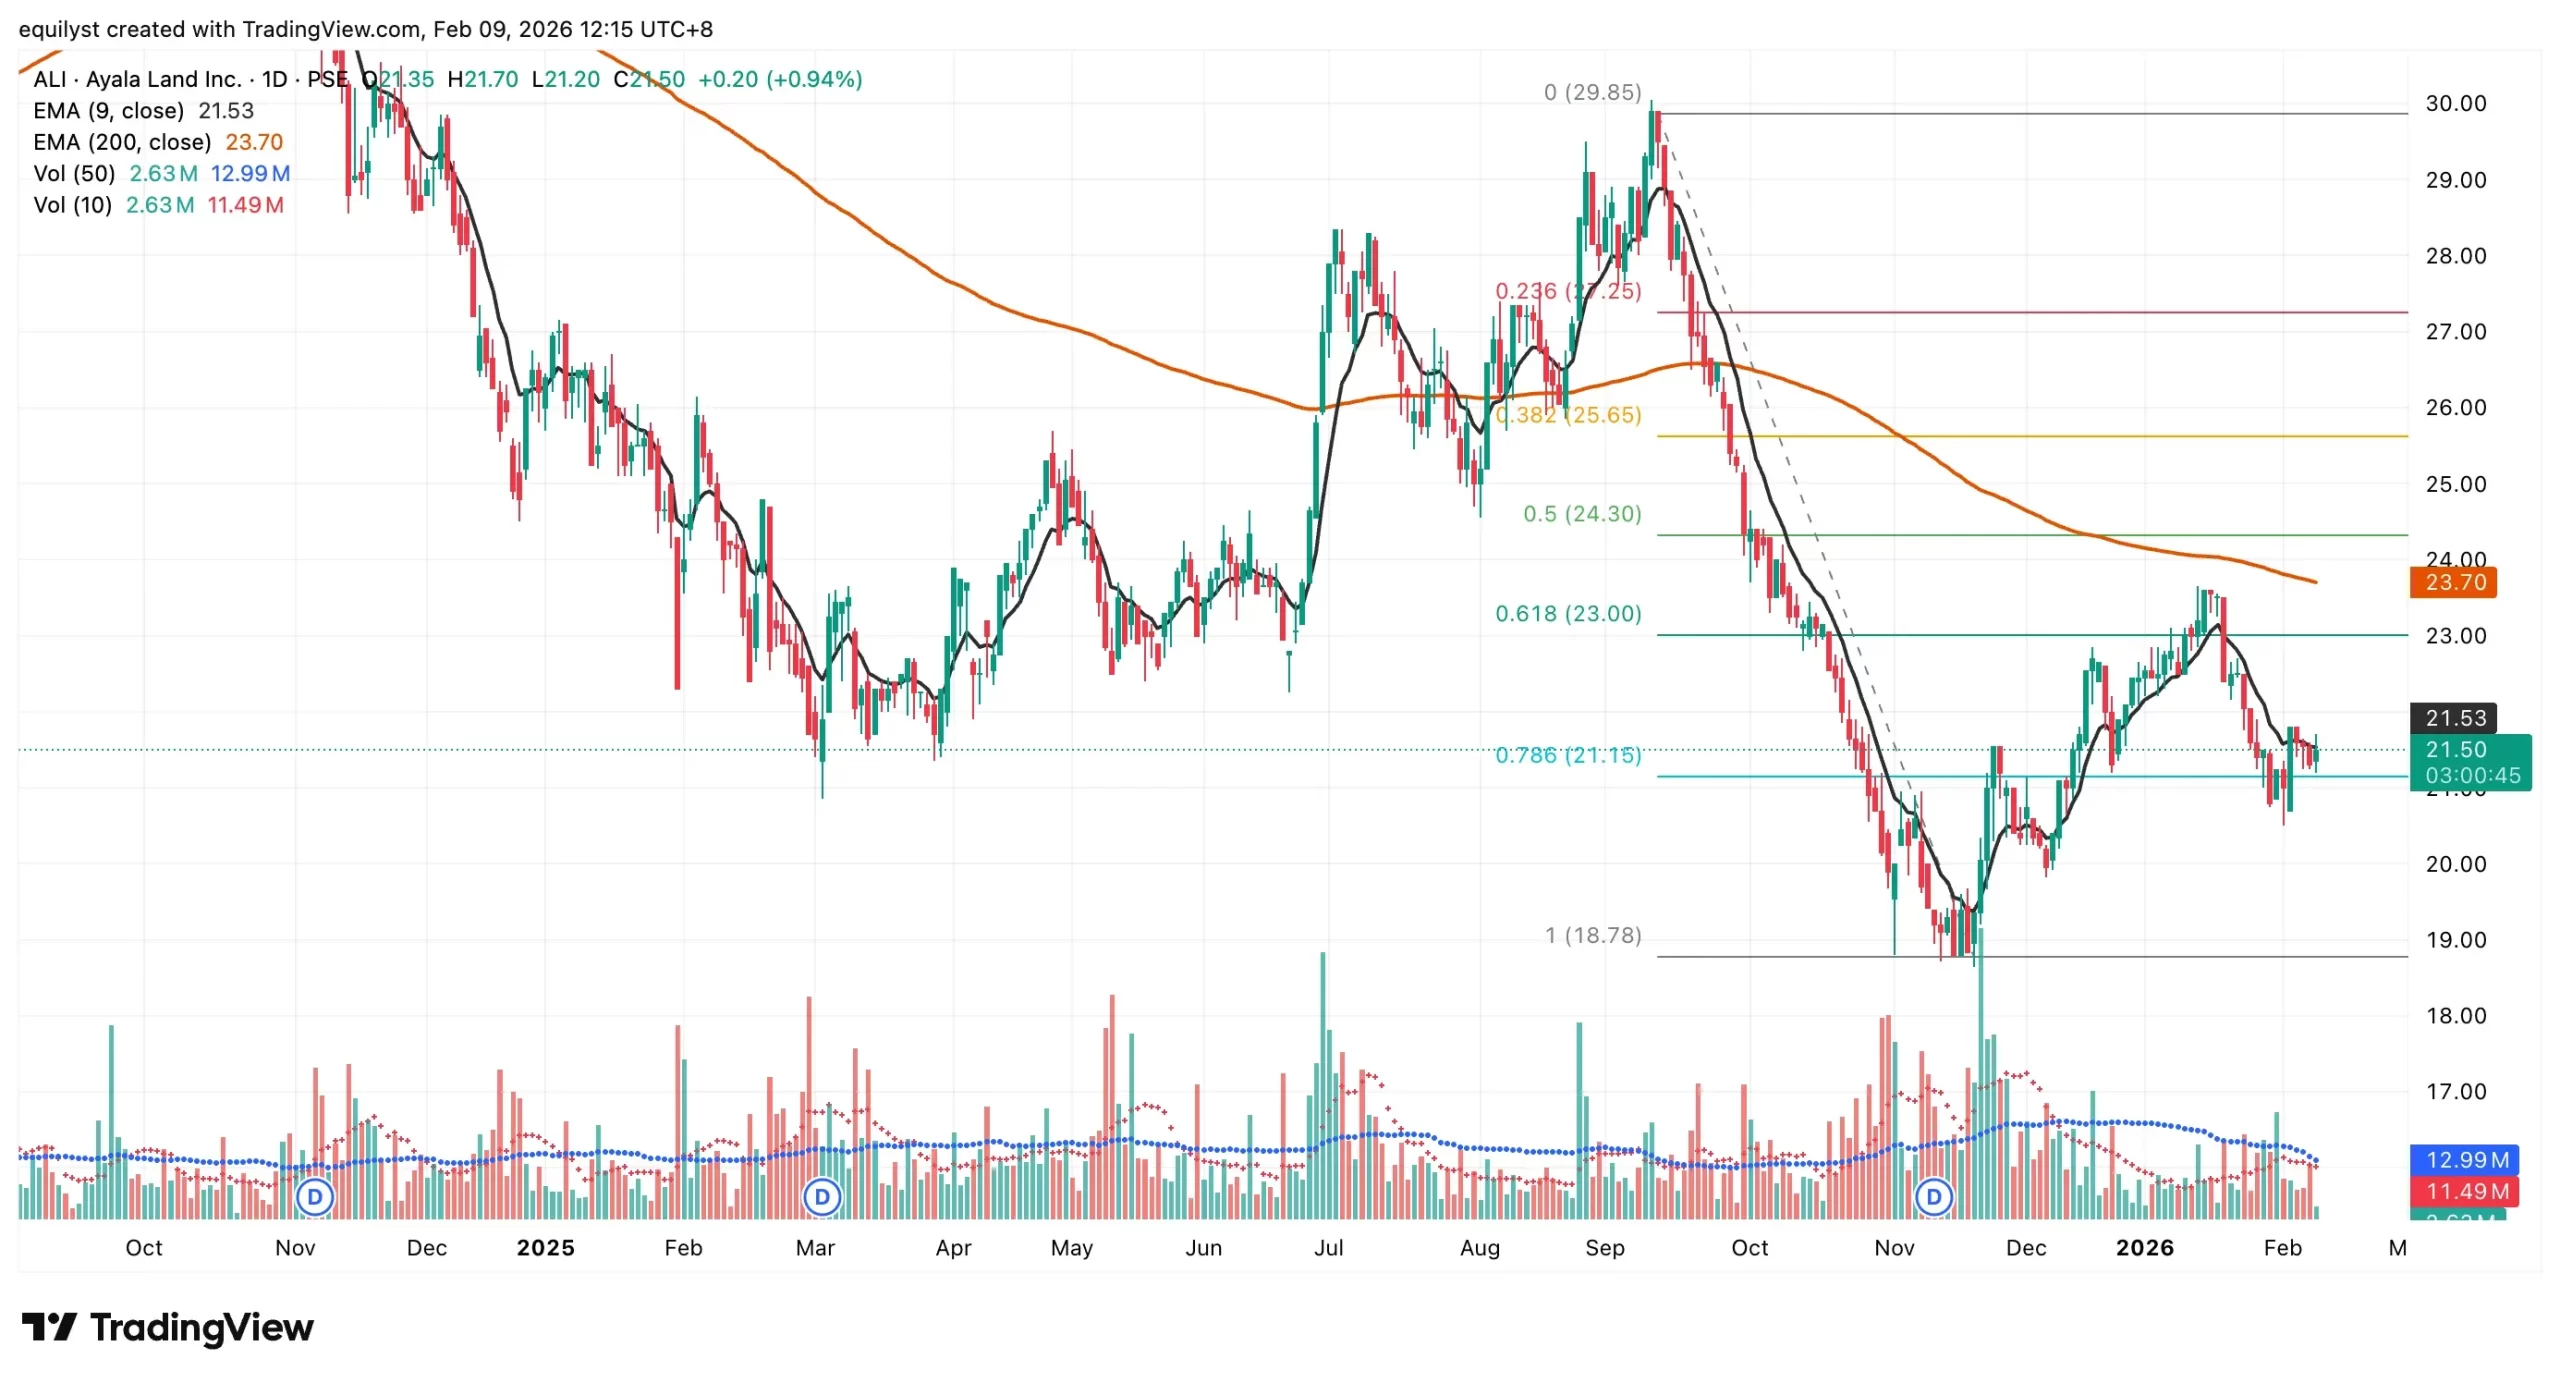
As of 11:44 a.m. on February 9, 2026, Ayala Land, Inc. (ALI) trades at ₱21.50, up 0.94% intraday. Despite the bounce, the technical posture remains weak across both time horizons. ALI continues to trade below its 10-day Exponential Moving Average (EMA) in the short term and below its 200-day EMA in the long term, keeping downside risk structurally intact.
ALI disclosed a share buyback on February 6, 2026, acquiring 1.6 million shares at ₱21.30 and an additional 300,000 shares at ₱21.35. While buybacks may provide near-term price support, they do not override prevailing trend conditions.
Key Support and Resistance Levels
Immediate support is located at ₱21.15, aligned with the 78.6% Fibonacci retracement. Immediate resistance stands at ₱23.00, aligned with the 61.8% Fibonacci retracement.
Although the last price sits closer to support than resistance, favorable reward-to-risk geometry alone does not justify entry. Without confirmation from volume, range behavior, or sentiment, probability remains skewed toward caution.
Volume Conditions and Intraday Risk
At the time of reporting, ALI’s volume stands at roughly one-sixth of its 10-day volume average. Thin participation limits conviction and increases susceptibility to intraday reversals, particularly after the midday recess.
Dominant Range Index Assessment
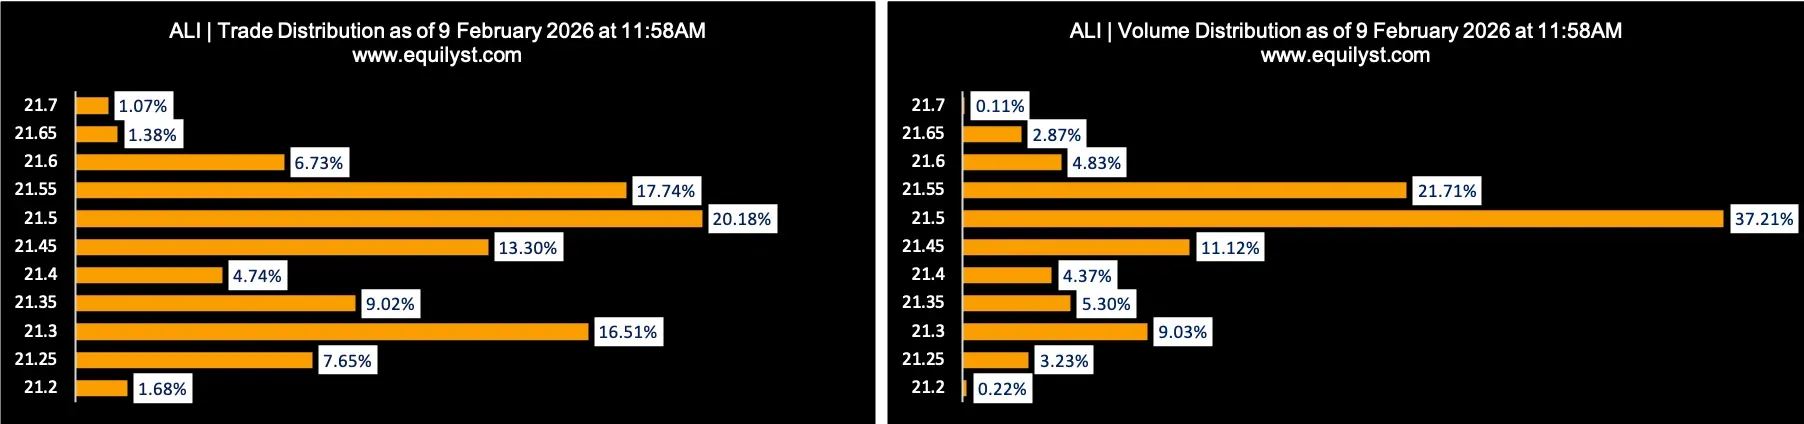
ALI holds a bearish Dominant Range Index as of this writing. The most active price range clusters closer to the intraday high, while the current price remains below volume-weighted average price (VWAP), reflecting weak acceptance at higher levels.
Dominant Range Index: BEARISH
Last Price: 21.45
Dominant Range: 21.30 – 21.55
VWAP: 21.4755
Market Sentiment Index Perspective
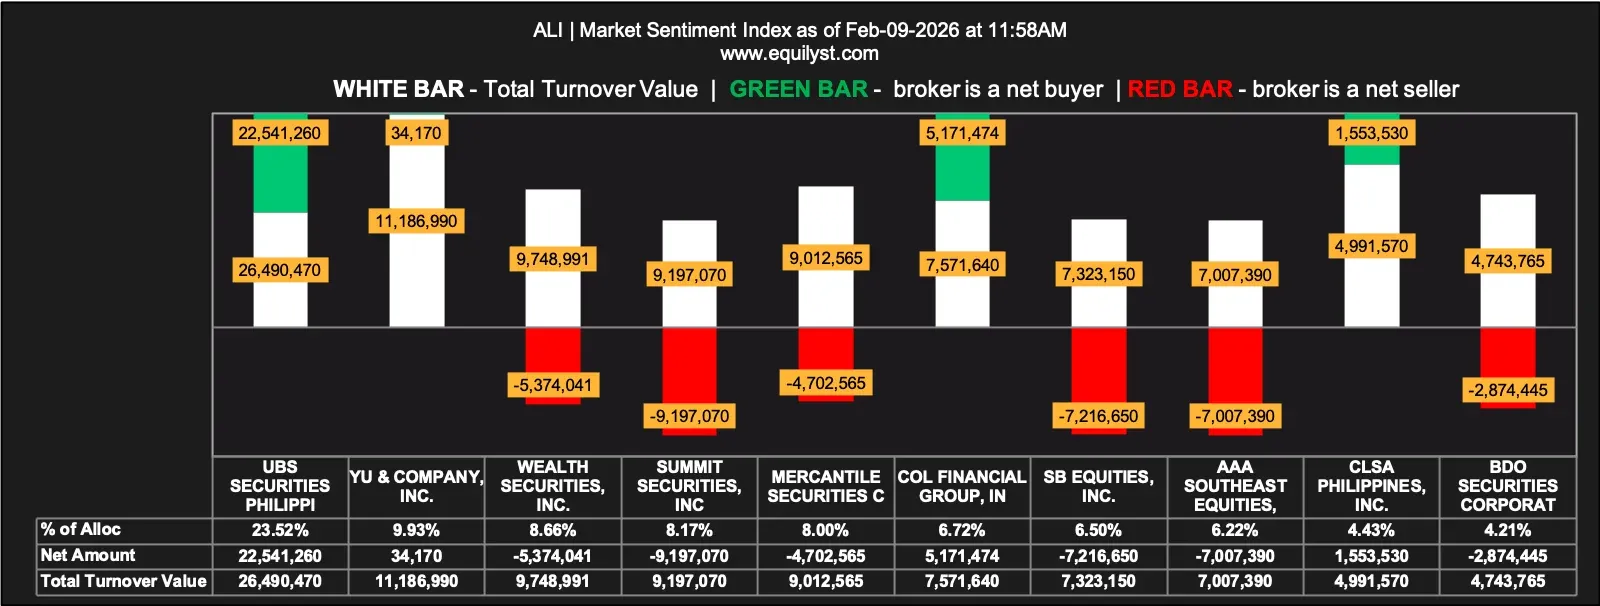
ALI also registers a bearish Market Sentiment Index. While a majority of brokers posted a positive aggregate net amount, the aggregate selling average remains higher than the aggregate buying average, signaling restrained conviction behind buying activity.
Market Sentiment Index: BEARISH
22 of the 35 participating brokers, or 62.86% of all participating brokers, posted a positive Aggregate Net Amount
17 of the 35 participating brokers, or 48.57% of all participating brokers, posted a higher Per-Broker Buying Average than Per-Broker Selling Average
Aggregate Buying Average: ₱21.45305
Aggregate Selling Average: ₱21.48509
7 out of 35 participants, or 20.00% of all participants, registered 100% Per-Broker BUYING activity
6 out of 35 participants, or 17.14% of all participants, registered 100% Per-Broker SELLING activity
Consolidated Outlook and Risk Framing
Short-term traders face elevated risk due to thin volume and unfavorable range placement. Intraday gains lack confirmation, leaving price vulnerable to late-session pullbacks.
Long-term investors still contend with a stock trading below its 200-day EMA. Until volume and broker-level conviction improve, recoveries appear tactical rather than structural.
Additional context or structured review support may be requested through the consultancy form below.