Price Action and Candlestick Structure
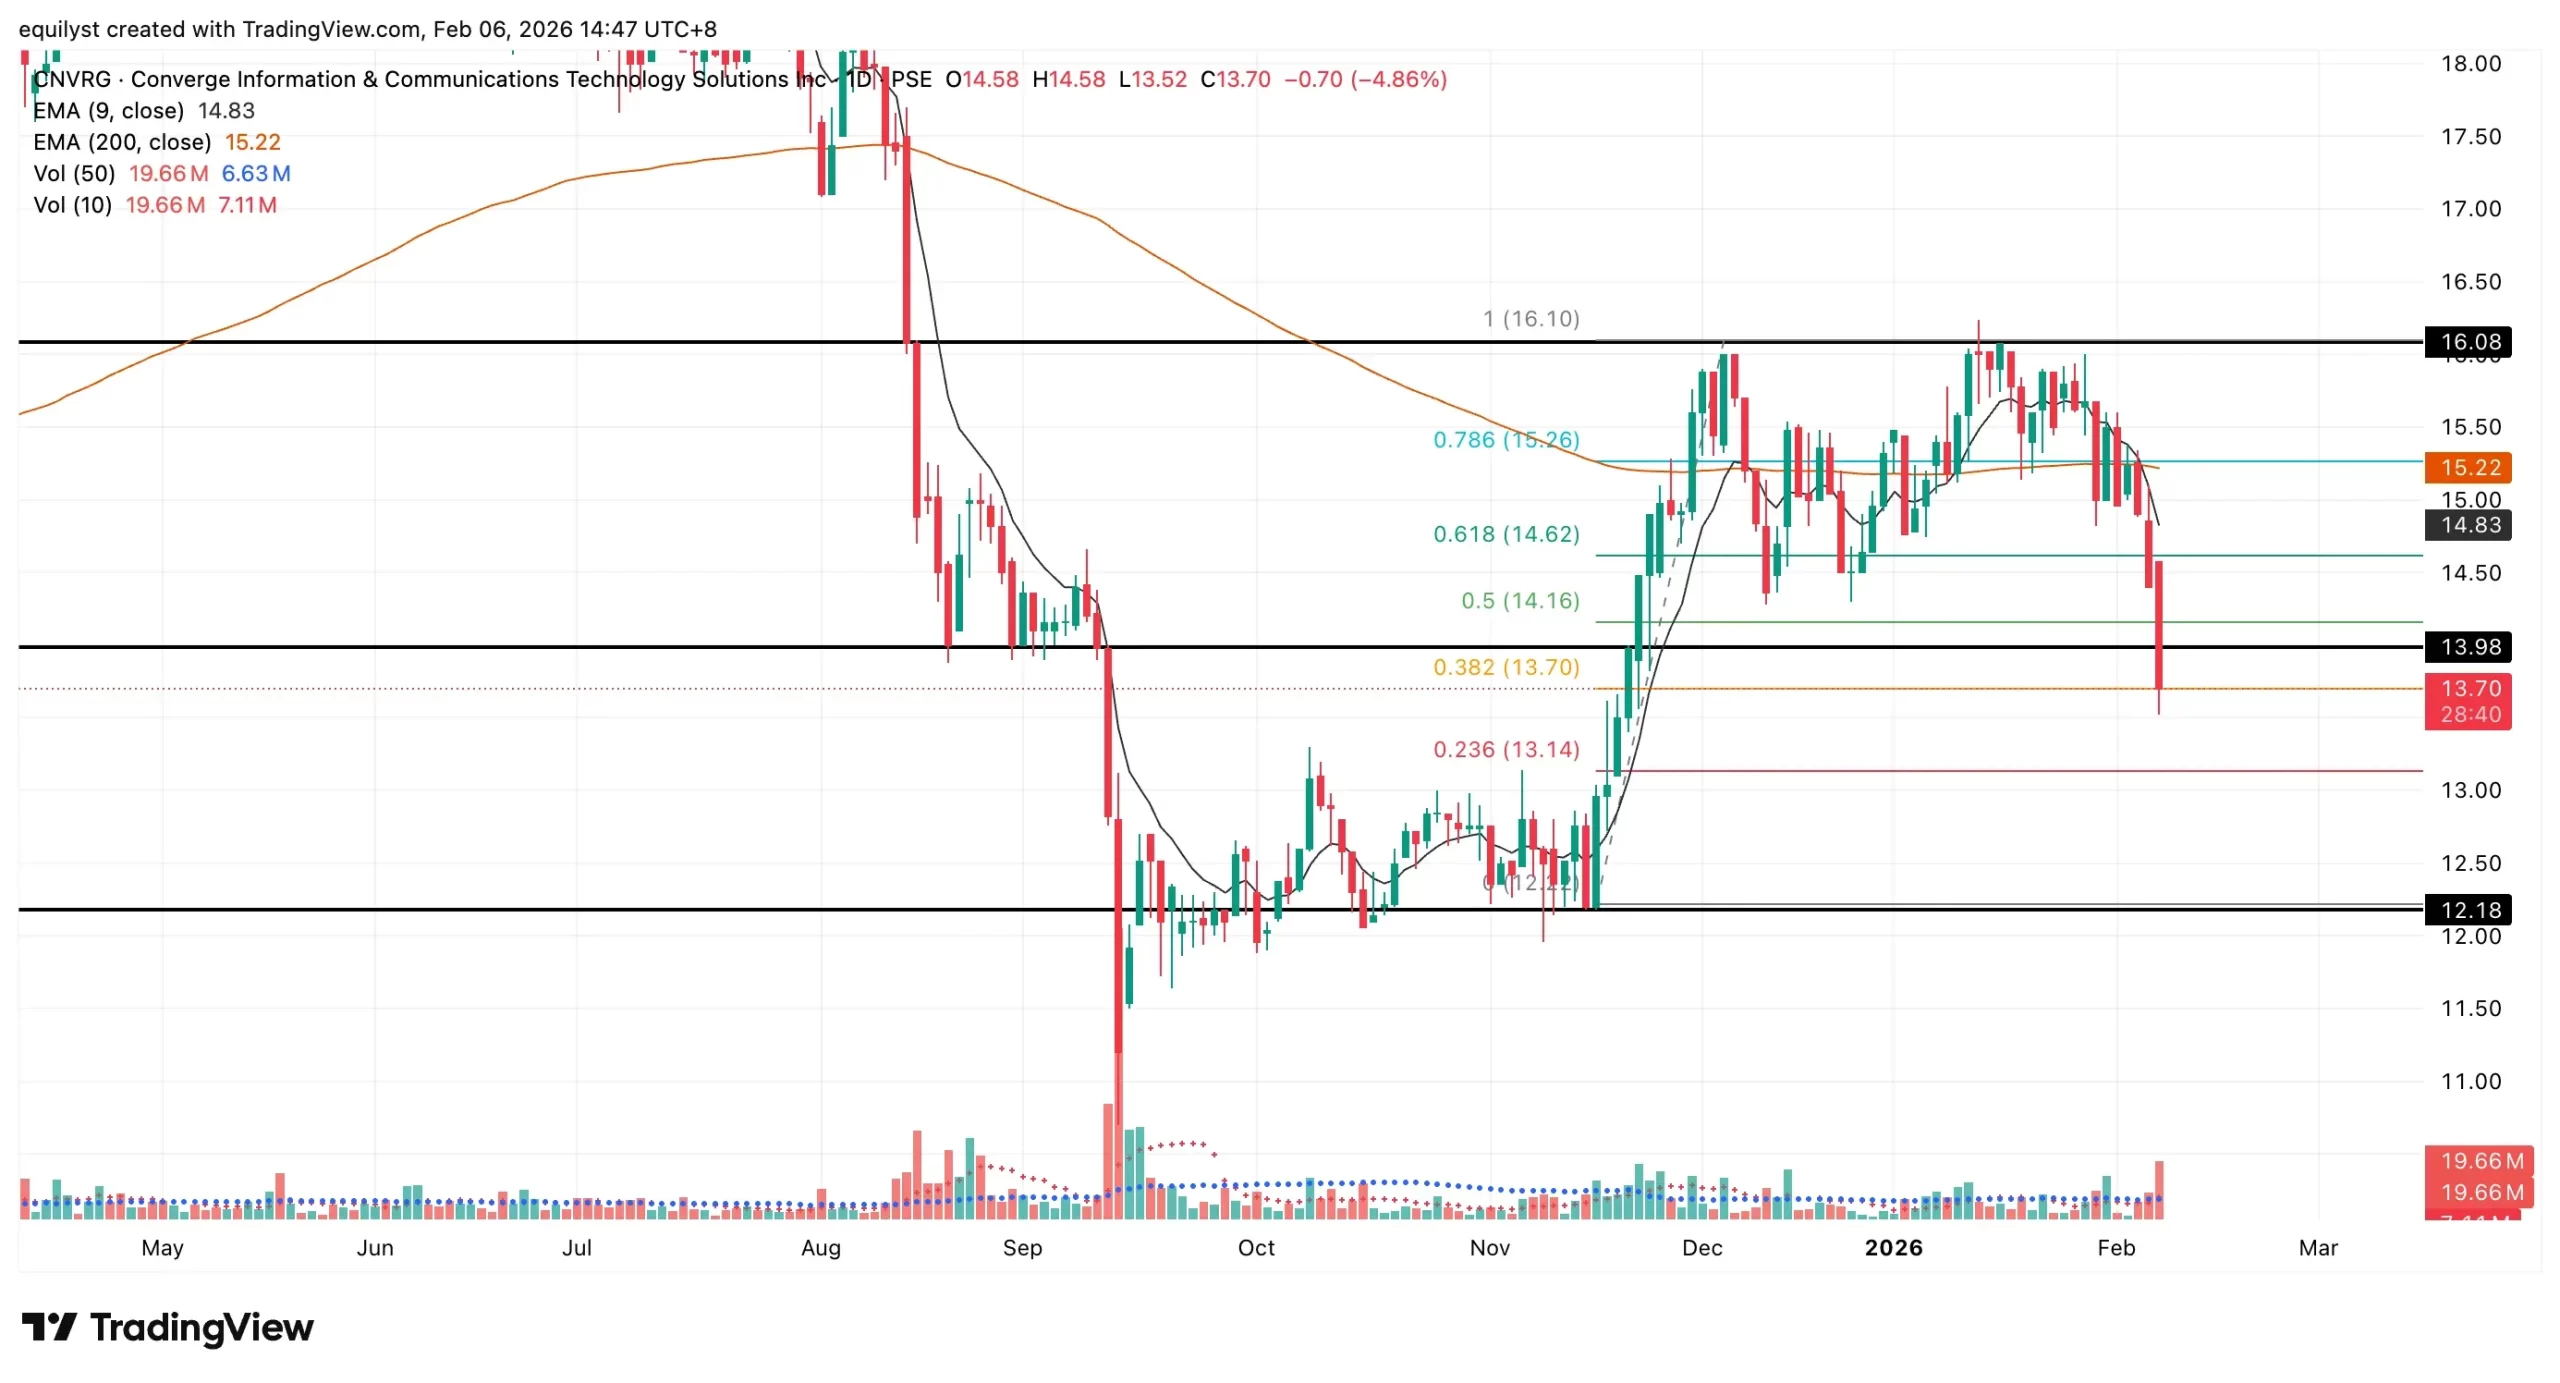
Converge Information and Communications Technology Solutions (CNVRG) has printed three consecutive bearish candlesticks, each engulfing the body of the prior day’s red candle. This sequence reflects persistent selling pressure and points to continuation rather than a temporary pullback. As of 2:34 p.m. on February 6, 2026, CNVRG trades at ₱13.80 per share, down 4.17% for the session.
Key Levels and Fibonacci Context
Technical confidence weakened further when CNVRG failed to reclaim ₱14.62, the 61.8% Fibonacci retracement level that had been acting as a key resistance. The subsequent breakdown below ₱14.00 effectively reclassifies that area into immediate resistance.
On the downside, ₱13.14, corresponding to the 23.6% Fibonacci retracement, now serves as the nearest technical support. A daily close below ₱13.70, particularly if accompanied by bearish volume, increases the likelihood of a retest toward this lower Fibonacci level.
Volume Analysis and Participation
Volume behavior continues to validate the bearish bias. Over the past three trading days, CNVRG’s daily volume has consistently exceeded 100% of its 10-day average, signaling active distribution rather than muted selling. In addition, both yesterday’s and today’s volumes were higher than 100% of the 50-day average, underscoring decisive sell-side participation.
Intraday Structure: Dominant Range Index
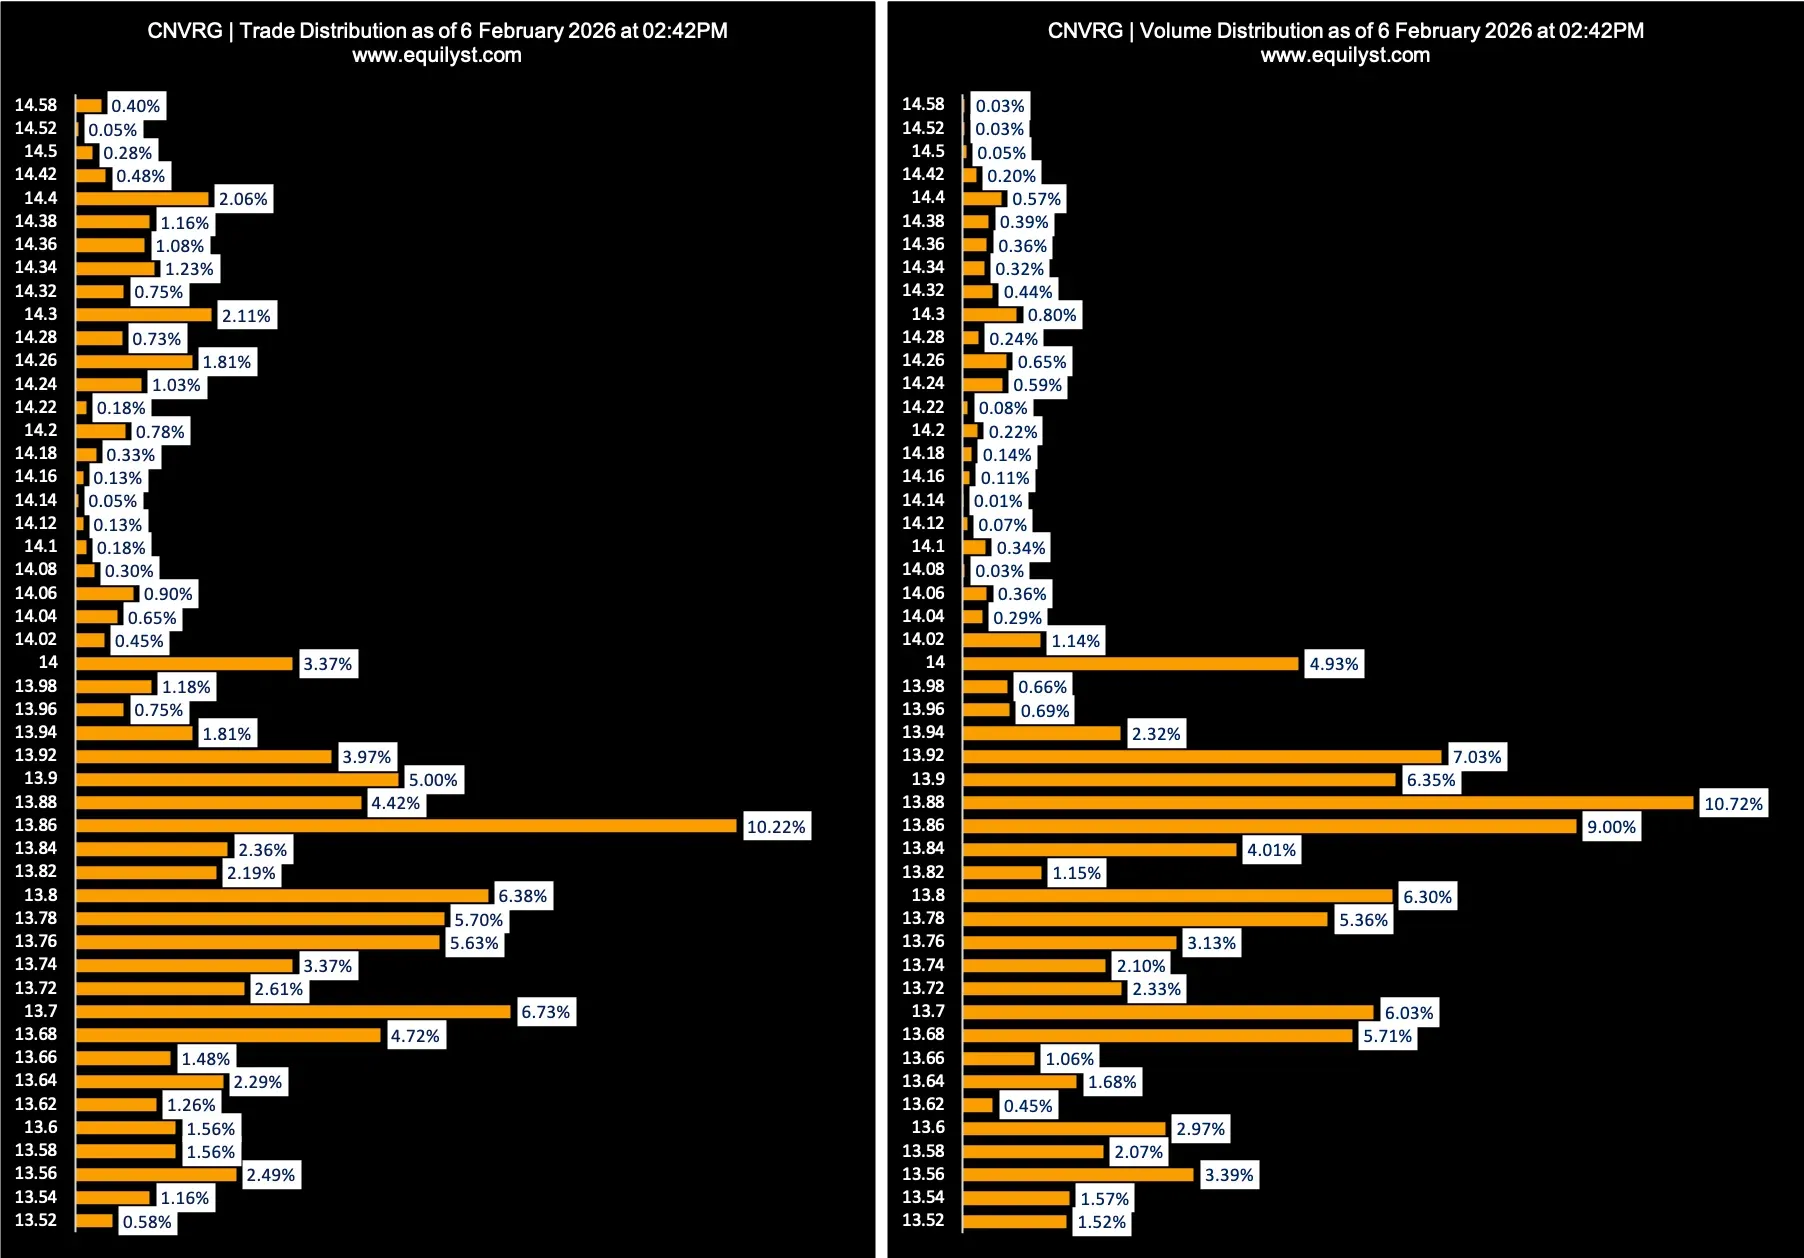
Intraday data aligns with the broader bearish narrative. CNVRG’s Dominant Range Index reflects a bearish bias, with the price range that attracted the highest volume and trade count occurring closer to the intraday low than the intraday high. Price action has also struggled to sustain levels above the volume-weighted average price, indicating limited upside follow-through despite intraday attempts to stabilize.
- Bias: Bearish
- Last Price: ₱13.66
- Dominant Range: ₱13.68 – ₱13.92
- VWAP: ₱13.8279
Market Sentiment vs. Price Behavior
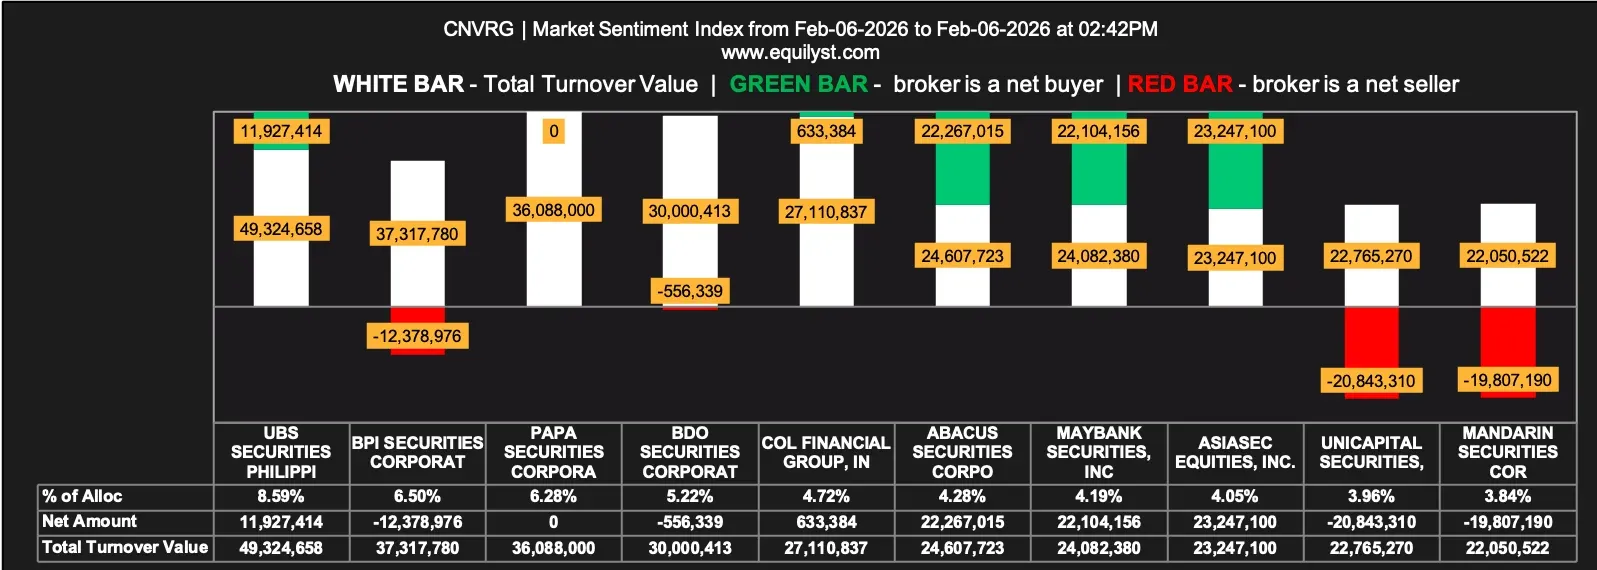
In contrast, CNVRG’s Market Sentiment Index presents a divergent intraday picture. A majority of participating brokers recorded a positive net amount, with buying averages exceeding selling averages for most participants. Notably, around 40% of the 69 participating brokers registered pure buying activity, while only one participant recorded pure selling.
- Positive Net Amount: 50 of 69 brokers (72.46%)
- Higher Buying vs. Selling Average: 48 of 69 brokers (69.57%)
- Average Buying Price: ₱13.87165
- Average Selling Price: ₱13.85481
- 100% Buying Activity: 28 brokers (40.58%)
- 100% Selling Activity: 1 broker (1.45%)
Conclusion and Decision Framework
CNVRG’s current technical structure remains skewed to the downside, with price action, volume behavior, and intraday range dynamics collectively favoring caution. The inability to reclaim key Fibonacci resistance levels, combined with expanding sell-side participation, suggests that downside risks have yet to be fully resolved.
While intraday sentiment data indicates selective accumulation, this divergence highlights a split between short-term positioning and broader technical weakness. From a decision-making standpoint, this reinforces the importance of aligning any positioning with predefined risk levels, confirmation criteria, and exit conditions rather than reacting solely to price declines.
This analysis focuses on market structure, participation, and conditional outcomes and does not constitute a buy or sell recommendation. Any position should remain consistent with the trader’s original thesis, time horizon, and risk management rules. For those evaluating CNVRG within a broader portfolio context and seeking clarity on scenario planning, invalidation levels, or risk positioning, a more structured review may be warranted.